present
Zarejestruj się i otrzymaj 50 $ zniżki na pierwszy zakup
Trading product for Break Tracer Wskaźnik EMA SMA, image 1
Break Tracer
Wskaźnik
112 pobrania
Wersja 1.0, Sep 2026
Windows, Mac
4.6
Opinie: 3
Trading product for Break Tracer Wskaźnik EMA SMA, image 2
Trading product for Break Tracer Wskaźnik EMA SMA, image 3
Trading product for Break Tracer Wskaźnik EMA SMA, image 4
Trading product for Break Tracer Wskaźnik EMA SMA, image 5
Trading product for Break Tracer Wskaźnik EMA SMA, image 6
Trading product for Break Tracer Wskaźnik EMA SMA, image 7
Trading product for Break Tracer Wskaźnik EMA SMA, image 8
Trading product for Break Tracer Wskaźnik EMA SMA, image 9
Trading product for Break Tracer Wskaźnik EMA SMA, image 10
Trading product for Break Tracer Wskaźnik EMA SMA, image 11
16
Sprzedaż
339
Bezpłatne instalacje

Opis

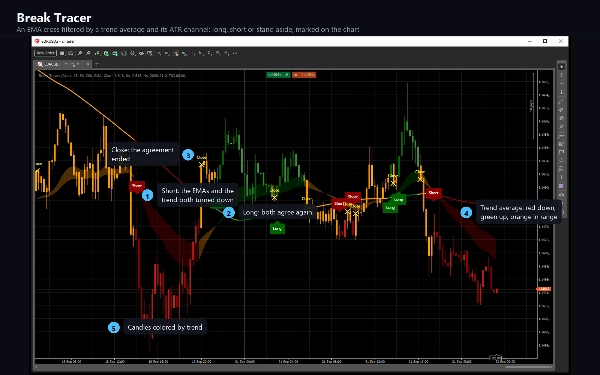
Break Tracer odczytuje trend na dwóch warstwach i działa tylko wtedy, gdy się zgadzają.


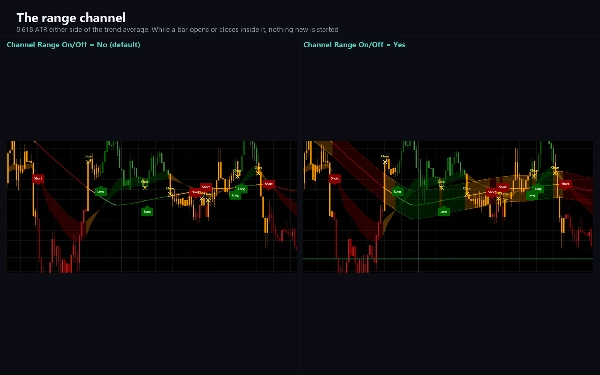
Szybka para wykładniczych średnich kroczących (26 i 50) wskazuje kierunek krótkoterminowy. Średnia trendu z 200 słupków, z kanałem o 0.618 razy średni zakres prawdziwy wokół niej, wskazuje trend. Gdy szybka para wskazuje w górę, a cena jest powyżej średniej trendu, trend jest wzrostowy; gdy obie wskazują w dół, jest spadkowy; a gdy słupek otwiera się lub zamyka wewnątrz kanału, rynek traktowany jest jako konsolidujący i nic nowego nie jest rozpoczynane.


CO WIDZISZ


Linia trendu w odcieniach zieleni lub czerwieni, pomarańczowa gdy rynek konsoliduje.

Pasma zacienione między dwiema szybkimi średnimi, w tych samych kolorach.

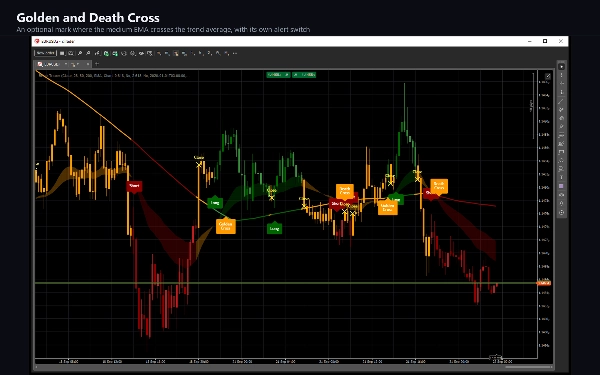
Płyta Long pod słupkiem, gdzie zaczyna się trend wzrostowy, oraz płyta Short nad słupkiem, gdzie zaczyna się trend spadkowy.

Żółty krzyżyk, gdzie pozycja jest zamykana, ponieważ trend lub szybkie średnie się odwróciły.

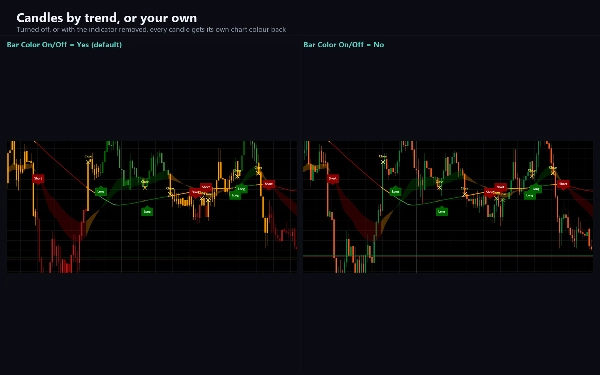
Świece kolorowane według trendu, z jaśniejszym odcieniem dla świecy zamykającej się przeciwko niemu.

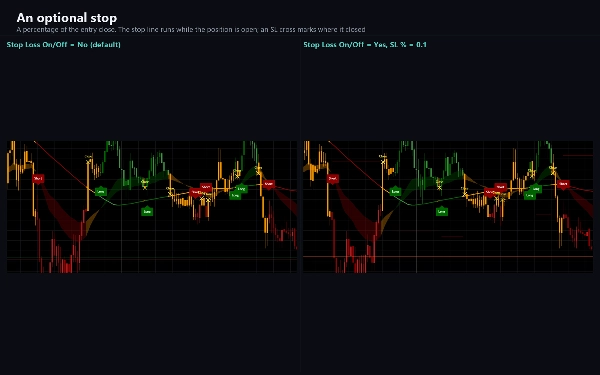
Opcjonalnie: sam kanał, linia stopu ze znakiem SL na poziomie zamknięcia pozycji, płyty Golden Cross i Death Cross, gdy średnia średnia przecina średnią trendu, oraz szare zacienienie poza wybranym oknem daty.


JAK UŻYWAĆ


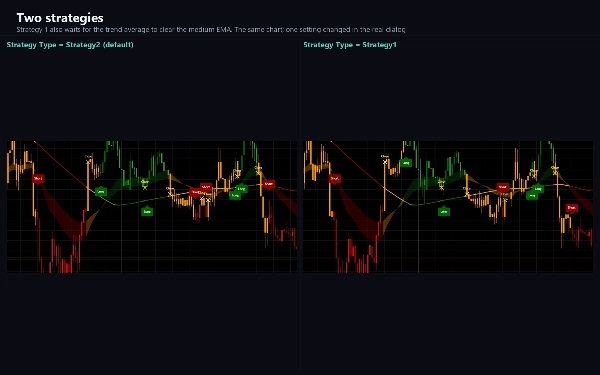
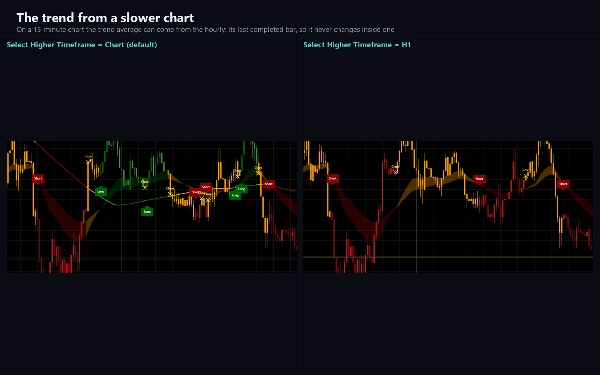
Płyta Long lub Short oznacza moment, gdy obie warstwy się zgadzają; krzyżyk zamknięcia oznacza moment, gdy przestają się zgadzać. Strategia 2, domyślna, przyjmuje każde porozumienie; Strategia 1 jest bardziej rygorystyczna i stoi z boku, gdy średnia trendu jest nadal po niewłaściwej stronie średniej średniej. Można wybrać tylko Long, tylko Short lub oba. Średnia trendu może pochodzić z wyższego interwału - na przykład godzinowego na wykresie pięciominutowym - i wtedy używa ostatniego zakończonego słupka wyższego interwału, więc nie zmienia się w trakcie tego słupka.


USTAWIENIA


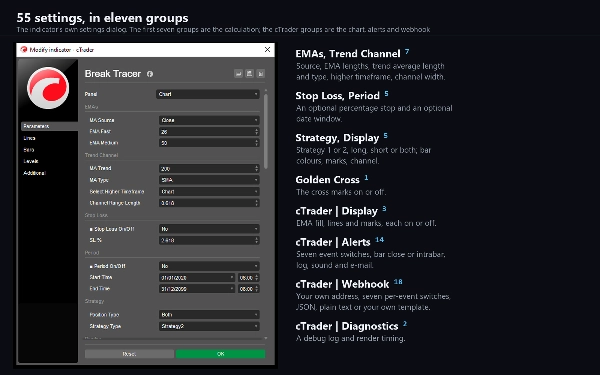
Źródło, długości EMA, długość i typ średniej trendu (SMA lub EMA), wyższy interwał, szerokość kanału, opcjonalny procentowy stop, opcjonalne okno dat, typ strategii i które strony brać. Każdy element rysunku ma własny przełącznik, a wyłączenie jednego zmienia tylko rysunek: wartości, alerty i webhook działają dalej.


ALERTY I WEBHOOK


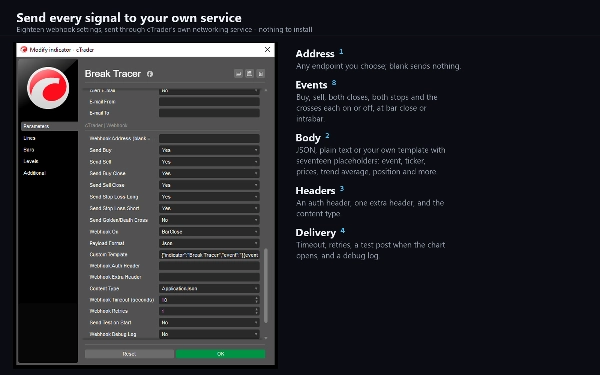
Sześć zdarzeń: Kup, Sprzedaj, Zamknięcie Kupna, Zamknięcie Sprzedaży, Stop Loss Long i Stop Loss Short, plus opcjonalnie Golden i Death Cross. Każde ma własny przełącznik i może wyzwalać się przy zamknięciu słupka lub natychmiast po spełnieniu warunku. Dostawa to linia logu, dźwięk lub e-mail. Jest też webhook: wpisz adres, a każde zdarzenie jest wysyłane do niego jako JSON, zwykły tekst lub w szablonie, który sam napiszesz z miejscami na symbol, interwał, czas, ceny, średnie, stan trendu i pozycję. Pozostaje wyłączony, dopóki nie wpiszesz adresu, nic nie wysyła podczas przeglądu historii ani testu wstecznego, i nie wymaga specjalnych uprawnień – posty wychodzą przez własną usługę sieciową cTrader.


DLA cBOTÓW


Średnia trendu, obie szybkie średnie, stan trendu i stan pozycji są publikowane jako serie wyjściowe.


TYP I OKNO


Wskaźnik trendu, rysowany na wykresie cenowym.


INTERWAŁY I INSTRUMENTY


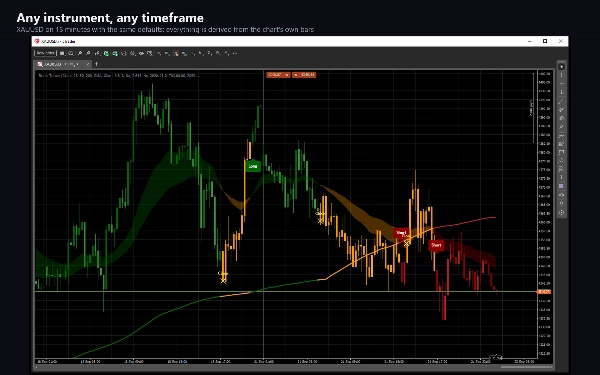
Dowolny interwał oparty na czasie; domyślne dobrze czytają się od M5 do H4, a opcja wyższego interwału pozwala wykresowi niskiego interwału podążać za wolniejszym trendem. Działa na dowolnym instrumencie – parach walutowych, metalach, indeksach i kryptowalutach – ponieważ wszystko, co wykorzystuje, pochodzi bezpośrednio ze słupków.


DLA KOGO JEST


Traderzy, którzy chcą mieć filtr trendu, który mogą zobaczyć: kiedy być na Long, kiedy na Short, kiedy się wycofać, oraz alert przy każdej zmianie.


UWAGI


Znaczniki podążają za słupkiem, który nadal się formuje, więc jeden może pojawić się i zniknąć, dopóki ten słupek się nie zamknie. Alerty i posty webhook domyślnie działają przy zamknięciu słupka, gdy warunek jest ostateczny. Na świeżym wykresie pierwszy znacznik to Short na drugim słupku, ponieważ nic nie można zmierzyć, dopóki średnie nie istnieją.


Trading wiąże się z ryzykiem. Wyniki historyczne nie gwarantują przyszłych rezultatów.

Podsumowanie

Podsumowanie AI
Break Tracer is a trend indicator designed for use on price charts across any time-based timeframe, suitable for instruments including forex pairs, metals, indices, and cryptocurrencies. It combines two layers of trend analysis: a fast pair of exponential moving averages (EMAs) with periods 26 and 50 to capture short-term direction, and a slower 200-bar trend average (SMA or EMA) surrounded by an ATR-based channel (0.618 times the average true range) to define the overall trend. The indicator signals a trend only when both layers agree—uptrend when fast EMAs point up and price is above the trend average, downtrend when both point down, and a ranging market when price bars fall inside the ATR channel.

Visual elements include a color-coded trend line (green/red for trend, orange for range), shaded bands between fast EMAs, Long and Short plates marking trend starts, yellow crosses indicating position closes, and candles colored by trend strength. Optional features include the ATR channel display, stop lines with stop-loss crosses, Golden and Death Cross plates, and customizable date window shading.

Break Tracer supports configurable strategies for trade entries and exits, higher timeframe trend averaging, and selective long/short signals. It provides six alert events (Buy, Sell, Close, Stop Loss, Golden/Death Cross) with customizable delivery via log, sound, email, or webhook posting JSON or templated messages. Output series for cBots include trend averages and position states. Settings allow adjustment of sources, lengths, channel width, stop percentages, and visual elements independently.
Profil wskaźnika
Kategoria wskaźnika
Trend
Typ wyjścia
Wizualizacja
Sygnały
Wymagania dotyczące danych
Tylko słupki
Obsługiwane sygnały
Przecięcie
Przebicie poziomu

Dyskusja

Opinie klientów

4.6
Opinie: 3
5
67 %
4
33 %
3
0 %
2
0 %
1
0 %
Opinie klientów
October 11, 2026
Break Tracer combines a fast EMA layer with a slower trend filter into a clear visual regime model. Testing on EURUSD and XAUUSD across H1 and M1 showed consistent trend colors, Long/Short transitions, Close markers and stable rendering.
October 6, 2026
The 26 and 50 EMA crossover gets useful context from a 200 bar trend average and a 0.618 ATR channel. Higher timeframe values wait for their candle to close, with webhooks available for alerts rather than order execution by the indicator.
October 1, 2026

Częste pytania

EMA
SMA
Channel
ATR
Moving Average
Produkty dostępne za pośrednictwem cTrader Store, w tym boty handlowe, wskaźniki i wtyczki, dostarczane są przez deweloperów zewnętrznych i udostępniane wyłącznie w celach informacyjnych oraz w celu zapewnienia dostępu technicznego. cTrader Store nie jest brokerem i nie zapewnia doradztwa inwestycyjnego, nie udziela spersonalizowanych rekomendacji ani nie gwarantuje przyszłych wyników.

Więcej od tego autora

Wskaźnik
ATR
CCI
+4
A trend line that never steps back, a shaded band to the price, and a pointer at the swing where the trend turns.
cBot
Balanced
Fixed Lot
+5
Gold grid cBot for XAUUSD H1: four-signal confluence on closed bars, ladders closed at a basket profit, news filter
15.6%
ROI
2.33
Współczynnik zysku
Wskaźnik
ATR
RSI
+5
Fusion trend line with a layered cloud, BULL and BEAR labels, scored re-entry triangles and exit markers.
Wskaźnik
ATR
RSI
+4
RSI bands drawn on price, confluence-scored BUY/SELL signals, an ATR stop with three targets
Wskaźnik
ADX
ATR
+5
EMA-cross signals scored on six confluence layers, with an ATR stop, three targets and a live panel
Wskaźnik
ATR
RSI
+4
Adaptive Ichimoku with nine-factor confluence scoring, five signal types, smart TP/SL and an MTF panel.
Wskaźnik
ADX
ATR
+5
SuperTrend signals scored on five confluence factors, with an ATR stop, three targets and a dashboard.
Wskaźnik
ATR
EMA
+4
Range-filter BUY/SELL signals scored by four confluence layers, with a stop, five targets and a trend panel
Wskaźnik
ATR
Volume
+3
Fibonacci trend signals on closed bars, with an ATR stop, up to four targets and a break-even ladder.
Logo „QuotientDrift”
Statystyki na żywo
5.0
(1)
$97
/
$147
cBot
TP Manager
Break Even
+5
Gold cBot for prop-firm accounts: pick your firm, phase and size; risk is sized from the firm's rules, its limits kept
1.6
Współczynnik zysku
Wskaźnik
ATR
EMA
+2
Eight-EMA ribbon with ATR trade zones, a nine-symbol screener and a five-timeframe trend dashboard.
Wskaźnik
ADX
ATR
+5
Ten confluence layers scored on every closed bar, with an anti-chop gate, pivot levels and a live dashboard.

Możesz także polubić

Wskaźnik
ATR
MSS
+5
Advanced market structure and institutional cycle mapper with visual reference cards and entry alerts
Wskaźnik
Zero Lag MACD delivers ultra-responsive trend and divergence signals with minimal lag, empowering timely Forex entries.
Wskaźnik
Prop
Forex
+3
Price Change Bundle 3-in-1 Levels • Bars • Histogram. Secret of Price Change
Wskaźnik
Key Levels
Market Structure
+1
See the day's percentage targets from the open, so you know where the session stands at a glance.
Wskaźnik
RSI
Forex
+4
😎Read the description before purchasing💩
Wskaźnik
Simple MACD Histogram with color-coded rising (green) and falling (red) momentum bars.
Wskaźnik
RSI
Fibonacci
+1
Spot RSI divergences on your chart and get an entry, stop and six targets when your filters line up.
Wskaźnik
AI
EURUSD
Future-AI indicator.
Wskaźnik
Laser entries with pivot confirmation. No repaint, all timeframes. Professional results.
Wskaźnik
Forex
Enhance your trading strategy with automated detection and alerts for key chart patterns.
Logo „vwap”
Popularne
4.8
(5)
$26
Wskaźnik
VWAP
Forex
+2
Custom VWAP Indicator for cTrader
Wskaźnik
ATR
BOS
+5
Full ICT/SMC 4-step setup checker that alerts a long or short setup.
Wskaźnik
Imbalance
Key Levels
+1
Keep open imbalance zones, untouched session highs and lows and the day's ADR range in view, without scrolling back.
Wskaźnik
RSI
MACD
+7
The ZigZag indicator is a technical analysis tool primarily used to identify key price reversal points.
Wskaźnik
AI
ATR
+26
Entry Momentum MACD Power Guide
Wskaźnik
RSI
SMC
+17
The Dominator SMC Base, Smart Money Concept Indicator.
Wskaźnik
Forex
cTrader Auto Support & Resistance detects key levels with Fibonacci analysis and sends real-time trading alerts.
Logo „crossover 1”
Najwyżej oceniane
4.2
(5)
$19
/
$29
Wskaźnik
AI
Grid
+10
Crossover Buy and Sell Alerts and signals

Cena

16
Sprzedaż
339
Bezpłatne instalacje