


Opis
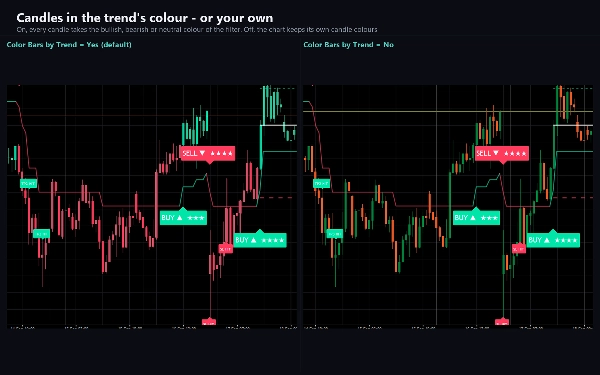
Wolf Blackout Trader stosuje jeden filtr zakresu i zmienia kolor każdej świecy zgodnie z jej trendem, dzięki czemu wykres
jest odczytywany jako byczy, niedźwiedzi lub neutralny na pierwszy rzut oka. Gdy trend się zmienia, zmiana jest oceniana przez cztery
warstwy konfluencji, i tylko zmiana z wystarczającą zgodą staje się sygnałem KUPNA lub SPRZEDAŻY. Każdy sygnał
przychodzi z poziomem stop, pięcioma celami i oceną w gwiazdkach.
CO RYSUJE
- Świece pokolorowane według trendu: byczy, niedźwiedzi lub neutralny, w wybranych przez Ciebie kolorach.
- Linia filtra zakresu w tych samych kolorach.
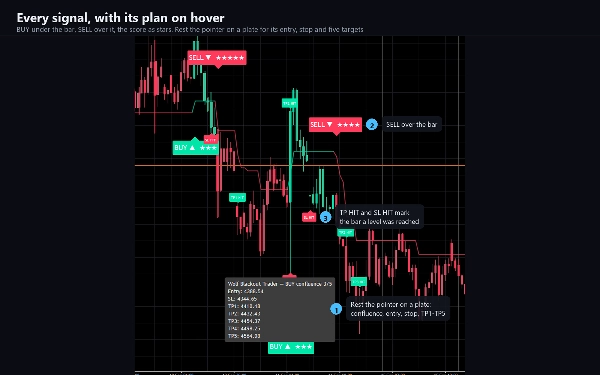
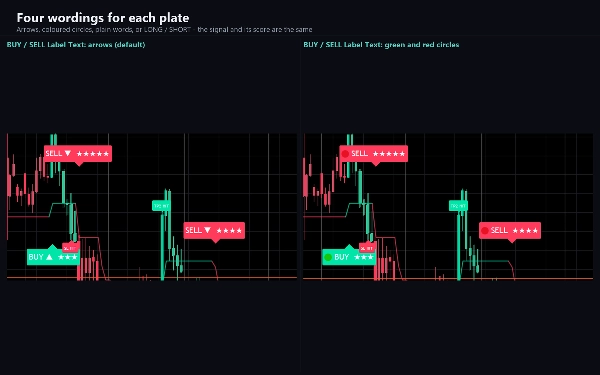
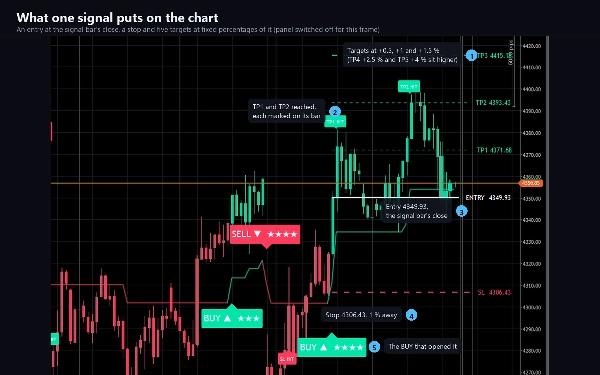
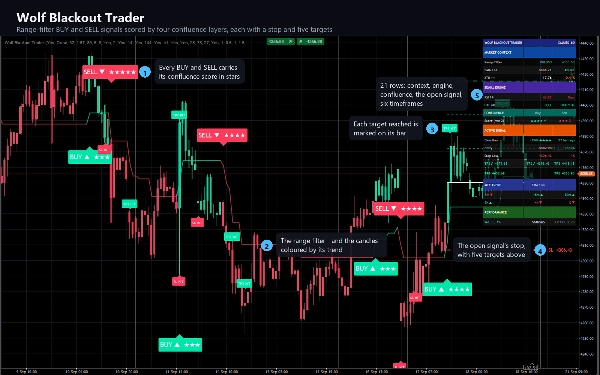
- Tabliczka na każdej świecy sygnałowej - KUPNO pod świecą, SPRZEDAŻ nad nią - z jedną do pięciu gwiazdek. Najedź
wskaźnikiem na tabliczkę, aby zobaczyć jej ocenę, wejście, stop i wszystkie pięć celów.
- Dla otwartego sygnału: linia wejścia, stop i pięć celów, każdy z ceną. Mała etykieta
oznacza każdy osiągnięty cel oraz stop, gdy zostanie osiągnięty.
- Małe diamenty na ekstremach momentum: pod świecą, gdy wolny RSI jest głęboko wyprzedany i nadal
słabnie, nad świecą, gdy jest wykupiony i nadal się wzmacnia.
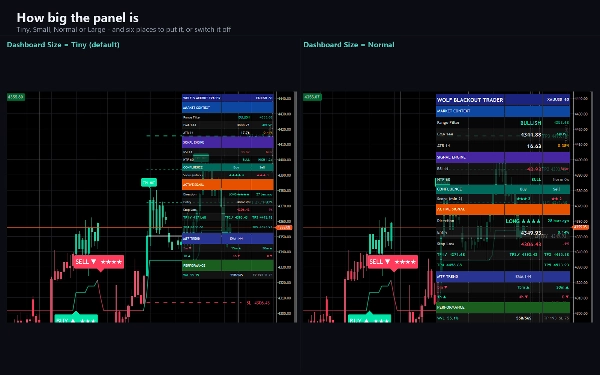
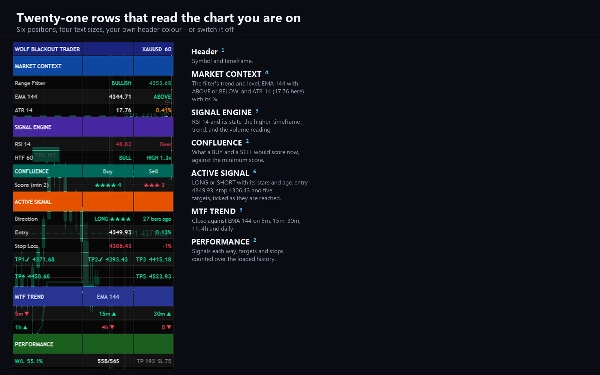
- Panel z dwudziestoma jednym wierszami: kontekst rynku (trend, EMA, ATR), silnik sygnału (RSI,
odczyt wyższego interwału czasowego i odczyt wolumenu), ocena, jaką KUPNO i SPRZEDAŻ otrzymałyby teraz,
aktywny sygnał z jego wejściem, stopem i celami zaznaczonymi w miarę ich osiągania, blok trendu dla sześciu
interwałów od pięciu minut do dziennego oraz bieżący licznik sygnałów, celów i stopów.
JAK DECYDUJE
Filtr przesuwa się tylko wtedy, gdy cena opuszcza wokół niego pasmo. Pasmo to średnia z szybkiego i wolnego
wygładzonego zakresu, więc ignoruje drobny szum i podąża za rzeczywistymi ruchami. Wyzwalaczem KUPNA jest pierwsza świeca, która
staje się bycza po niedźwiedzim okresie, a wyzwalaczem SPRZEDAŻY jest odwrotność.
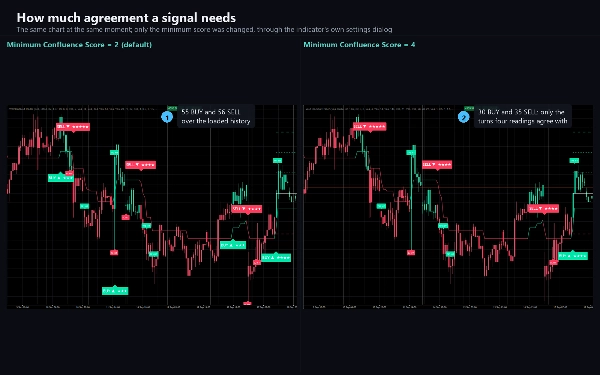
Każdy wyzwalacz zdobywa jeden punkt, plus jeden za każdą warstwę, która się zgadza: RSI po właściwej stronie 50, zamknięcie
po właściwej stronie EMA 144, ten sam test EMA na wyższym interwale czasowym, który wybierzesz (domyślnie jedna godzina), oraz wybuch wolumenu powyżej średniej z 20 świec. Wyzwalacz staje się sygnałem, gdy osiąga
minimalną ocenę (domyślnie dwa) i minęła wystarczająca liczba świec od ostatniego sygnału w tym kierunku.
Domyślnie sygnał jest decydowany, gdy jego świeca się zamyka. Warstwa, którą wyłączysz, zawsze dodaje swój punkt.
Stop i pięć celów to stałe procenty ceny wejścia, wszystkie regulowane. Osiągnięcie
piątego celu zamyka transakcję jako zysk. Stop zamyka ją jako zysk, jeśli pierwszy cel został osiągnięty
wcześniej, w przeciwnym razie jako stratę. Nowy sygnał zastępuje otwarty.
KLUCZOWE USTAWIENIA
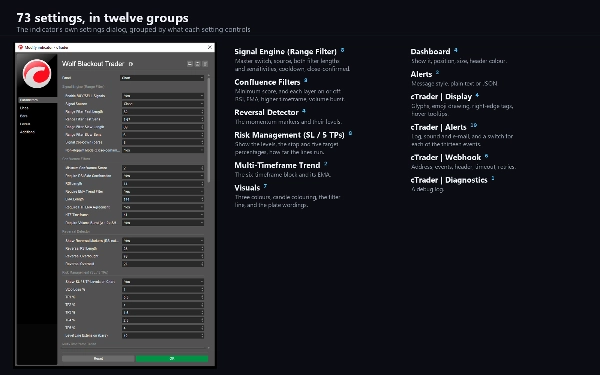
73 w dwunastu grupach: źródło sygnału, długości i czułości obu filtrów, czas chłodzenia i tryb potwierdzenia zamknięcia; minimalna ocena, każda warstwa konfluencji włączona lub wyłączona, długości RSI i EMA oraz
wyższy interwał czasowy; markery momentum i ich poziomy; stop i procenty pięciu celów oraz
jak daleko sięgają linie poziomów; długość EMA bloku trendu; trzy kolory, kolorowanie świec, linia filtra
i cztery napisy dla każdej tabliczki; pozycja panelu, rozmiar i kolor nagłówka; styl komunikatu alertu;
oraz grupy dla wyświetlania, alertów, webhooka i diagnostyki.
ALERTY I WEBHOOK
Trzynaście zdarzeń, każde z własnym przełącznikiem: KUPNO, SPRZEDAŻ, dowolny sygnał, pięciogwiazdkowe KUPNO lub SPRZEDAŻ, każdy
marker momentum, każdy z pięciu celów i stop. Dostarczane jako linia logu cTrader, dźwięk
wybranego przez Ciebie rodzaju oraz e-mail. Alert sygnału zawiera wejście, stop, wszystkie pięć celów i ocenę.
Nic nie jest wyzwalane podczas przeglądania historii wykresu przez wskaźnik i nic nie jest wyzwalane podczas testu wstecznego.
Webhook wysyła sygnały - a jeśli wybierzesz, cele, stop i zdarzenia markerów - jako JSON na dowolny adres,
który wpiszesz: bota handlowego, dziennik, przekaźnik, przepływ automatyzacji. Pozostaje wyłączony, dopóki nie wpiszesz adresu, jest deduplikowany dla każdego zdarzenia na świecę, ograniczony do dwudziestu wiadomości na minutę, a błąd jest logowany zamiast wyrzucany. Wysyła przez własną usługę sieciową cTrader, dlatego wskaźnik nie potrzebuje żadnych
uprawnień do plików ani sieci.
TYP I OKNO
Wskaźnik nakładkowy: wszystko jest rysowane na wykresie cenowym i nie dodaje oddzielnego panelu.
INTERWAŁY CZASOWE I INSTRUMENTY
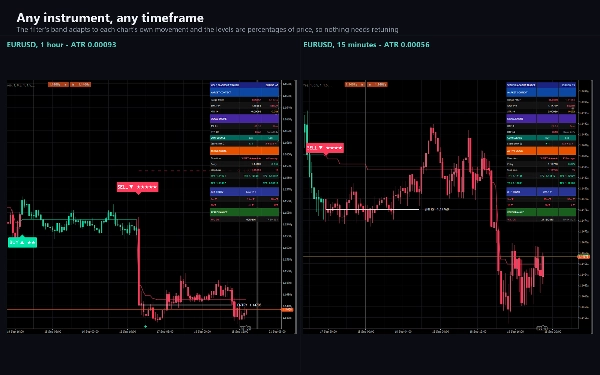
Dowolny interwał czasowy i dowolny instrument. Pasmo dostosowuje się do ruchu wykresu, poziomy
to procenty ceny, a ceny są formatowane zgodnie z tickiem Twojego brokera. Wskaźnik sam ładuje
inne interwały czasowe, które odczytuje.
ZASTOSOWANIA
- Odczytywanie trendu dowolnego wykresu na podstawie koloru jego świec.
- Branie pod uwagę tylko tych zmian, z którymi zgadza się kilka niezależnych odczytów.
- Przekształcanie każdego sygnału w plan: jeden stop i pięć celów, narysowanych z wyprzedzeniem.
- Sprawdzanie sześciu interwałów czasowych jednocześnie w panelu.
- Otrzymywanie informacji przez linię logu, dźwięk, e-mail lub webhook, gdy sygnał zostaje wyzwolony lub cel osiągnięty.
DLA KOGO JEST
Traderzy, którzy chcą jasnych punktów kupna i sprzedaży z filtrem trendu w tle, oraz każdy, kto chce, aby
sygnał przychodził z poziomem stop i drabiną celów zamiast strzałki.
WERSJA DEMONSTRACYJNA
Bezpłatna wersja próbna to pełny wskaźnik tylko na EURUSD - działa z każdym sufiksem brokera. Na innych symbolach
pokazuje komunikat i nic nie rysuje. Brak limitu czasu, brak ograniczonej historii, brak brakujących funkcji. Pełna
wersja usuwa ograniczenie symbolu i nic więcej nie zmienia.
UWAGI TECHNICZNE I OGRANICZENIA
Prawa dostępu: brak. Wskaźnik nie może czytać plików, uruchamiać procesów ani otwierać połączeń samodzielnie.
Jest to narzędzie do wykresów i analizy. Nie składa zleceń i nie ma dostępu do Twojego konta.
Warstwa wolumenu odczytuje wolumen ticków Twojego brokera, więc na innym feedzie może inaczej ocenić,
czy zmiana osiąga minimalną ocenę. Warstwa wyższego interwału czasowego odczytuje rozwijającą się
świecę wyższego interwału podczas działania wykresu i ukończone świece po przeładowaniu wykresu, więc sygnał
z sesji na żywo może się przesunąć po przeładowaniu. Sprawdzanie celów i stopów oraz markery momentum aktualizują się
w trakcie formowania świecy. Filtr stabilizuje się przez pierwsze kilkaset świec wykresu, więc załaduj trochę historii
przed odczytem najwcześniejszych sygnałów.
Wiersz PERFORMANCE panelu liczy, co narysowane poziomy spotkały na świecach załadowanych na wykres. Stop
osiągnięty po pierwszym celu liczy się jako wygrana, a sygnał zastąpiony przez następny nie jest liczony.
To opis tej historii, nie test wsteczny i nie prognoza.
WSPARCIE
Pytania kieruj przez zakładkę Dyskusja. Dołącz swojego brokera, symbol, interwał czasowy, wersję cTrader oraz
zrzut ekranu całego wykresu, a otrzymasz pomocną odpowiedź za pierwszym razem.
Trading wiąże się z ryzykiem. Wyniki historyczne nie gwarantują przyszłych rezultatów.
Podsumowanie
Each signal includes a defined entry, adjustable stop loss, and five profit targets, visually marked on the chart with price tags and a star rating indicating signal strength. Momentum extremes are highlighted with markers based on RSI conditions. A comprehensive 21-row panel displays market context, signal engine status, active signals with progress, multi-timeframe trend blocks, and cumulative counts of signals and targets.
The indicator supports customizable alerts via log lines, sounds, email, and JSON webhooks for integration with external tools. It requires no special access rights and does not place orders. Settings cover signal sources, filter parameters, scoring layers, target levels, colors, display options, and alert configurations. The tool is intended for traders seeking clear, scored buy/sell signals backed by multiple technical confirmations and a structured trade plan.
Opinie klientów
5 | 100 % | |
4 | 0 % | |
3 | 0 % | |
2 | 0 % | |
1 | 0 % |




























