Opis
Wskaźnik Klasteryzacji
Przegląd
Wskaźnik Klasteryzacji to potężne narzędzie zaprojektowane, aby pomóc traderom w identyfikacji wzorców, trendów i anomalii w danych rynkowych. Grupując podobne punkty danych w klastry, wskaźnik ten dostarcza cennych informacji, które można wykorzystać do podejmowania świadomych decyzji handlowych.
Funkcje
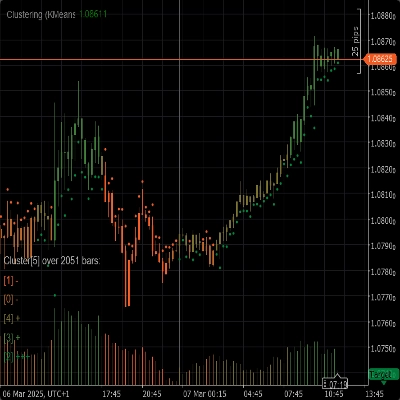
- Algorytmy Klasteryzacji: Wykorzystuje zaawansowane algorytmy klasteryzacji, takie jak K-Means i Gaussian Mixture Model (GMM), aby skutecznie segmentować dane rynkowe.
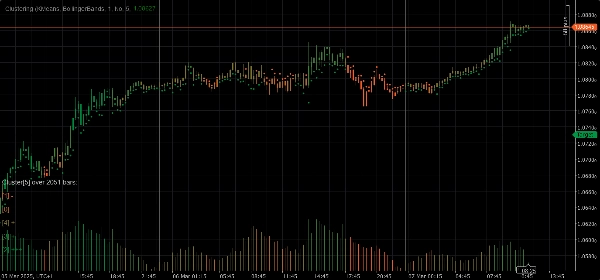
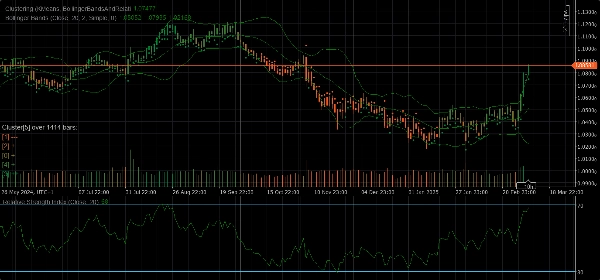
- Zestawy Cech: Oferuje różnorodne zestawy cech, w tym Cenę Surową, Wstęgi Bollingera, Wskaźnik Siły Względnej (RSI), Oscylator Stochastyczny, Wstęgi Bollingera i RSI oraz kombinacje tych wskaźników, aby uchwycić różne aspekty zachowania rynku.
- Dynamiczna Klasteryzacja: Automatycznie określa optymalną liczbę klastrów, zapewniając jak największą dokładność klasteryzacji.
- Wizualizacja: Zapewnia czytelne wizualizacje ruchów klastrów i zmienności bezpośrednio na wykresie.
Parametry
- Algorytm Klasteryzacji: Wybierz między K-Means a Gaussian Mixture Model (GMM), aby najlepiej dopasować do swojej strategii handlowej.
- Zestaw Cech: Wybierz spośród Ceny Surowej, Wstęg Bollingera, RSI, Oscylatora Stochastycznego, Wstęg Bollingera i RSI lub pełnego zestawu danych rynkowych zawierającego różne wskaźniki.
- Okno: Określ liczbę słupków branych pod uwagę dla każdego punktu danych.
- Auto K: Automatycznie określ liczbę klastrów na podstawie swoich danych.
- Początkowe K: Ustaw początkową liczbę klastrów, jeśli Auto K jest wyłączone.
- Maksymalna Liczba Historycznych Słupków: Ogranicz maksymalną liczbę historycznych słupków używanych do klasteryzacji. Jeśli ustawione na 0, używane są wszystkie dostępne słupki.
- Kolorowanie według Klastrów: Włącz lub wyłącz ponowne kolorowanie wykresu na podstawie aktualnych przypisań do klastrów.
- Pokaż Informacje: Wyświetl szczegółowe informacje o każdym klastrze bezpośrednio na wykresie.
- Pokaż Wskaźniki: Pokaż wskaźniki używane w zestawach cech.
Parametry Auto Adaptacji
- Auto Adaptacja: Włącz lub wyłącz tryb auto-adaptacji, który pozwala wskaźnikowi na ponowne inicjowanie klastrów na podstawie określonych warunków.
- Godzina Auto Adaptacji: Godzina dnia, w której może nastąpić auto-adaptacja (0-23).
- Okres Auto Adaptacji: Minimalna liczba godzin, które muszą upłynąć od ostatniej adaptacji, zanim może nastąpić kolejna.
Parametry Zestawu Cech
Parametry Wstęg Bollingera
- Okres: Okres do obliczania Wstęg Bollingera.
- Odchylenie: Mnożnik odchylenia standardowego dla Wstęg Bollingera.
- Typ Średniej Ruchomej: Typ średniej ruchomej używanej w obliczeniach Wstęg Bollingera (Prosta, Wykładnicza itp.).
Parametry Wskaźnika Siły Względnej (RSI)
- Okres: Okres do obliczania RSI.
Parametry Oscylatora Stochastycznego
- Okres: Okres K dla Oscylatora Stochastycznego.
- Spowolnienie K: Współczynnik spowolnienia K dla Oscylatora Stochastycznego.
- Okres D: Okres D dla Oscylatora Stochastycznego.
- Typ Średniej Ruchomej: Typ średniej ruchomej używanej w obliczeniach Oscylatora Stochastycznego (Prosta, Wykładnicza itp.).
- Typ Obliczeń: Typ obliczeń dla Oscylatora Stochastycznego (LowHigh, CloseClose itp.).
Użytkowanie
1. Dodaj Wskaźnik Klasteryzacji do swojego wykresu.
2. Skonfiguruj parametry zgodnie ze swoją strategią handlową.
3. Analizuj klastry i ich ruchy na wykresie.
4. Wykorzystaj informacje dostarczone przez wskaźnik do podejmowania świadomych decyzji handlowych.
Podsumowanie
Opinie klientów
5 | 50 % | |
4 | 50 % | |
3 | 0 % | |
2 | 0 % | |
1 | 0 % |


