Opis
Kwantowa ważona średnia krocząca (QWMA)
The Quantum Weighted Moving Average (QWMA) to zaawansowany wskaźnik handlowy zaprojektowany tak, aby dynamicznie dostosowywać ważenie przeszłych cen w oparciu o warunki rynkowe. W przeciwieństwie do tradycyjnych średnich kroczących, które stosują stałe wagi, QWMA wykorzystuje adaptacyjną funkcję wykładniczego zaniku, aby przypisać większe znaczenie ostatnim ruchom cen, jednocześnie uwzględniając dane historyczne.
Kluczowe cechy:
✅ Adaptacyjne ważenie: Dostosowuje wpływ przeszłych cen na podstawie zmienności i siły trendu.
✅ Zwiększona czułość: Reaguje szybciej na zmiany cen w porównaniu do prostych i wykładniczych średnich kroczących.
✅ Redukcja szumów: Pomaga filtrować szumy rynkowe, zachowując jednocześnie klarowność trendu.
✅ Konfigurowalne parametry: Pozwala traderom modyfikować czynniki zaniku i funkcje ważenia, aby dopasować się do różnych strategii handlowych.
Jak to działa:
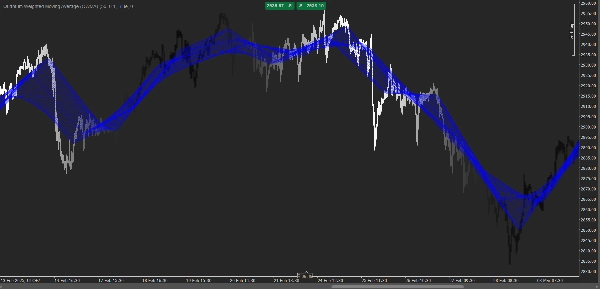
QWMA stosuje funkcję wykładniczego zaniku do danych cenowych z przeszłości, zapewniając, że starsze ceny mają malejący wpływ, podczas gdy nowsze wartości mają większe znaczenie. Skutkuje to gładszą, a jednocześnie bardziej responsywną linią trendu, która dostosowuje się do zmieniającej się dynamiki rynku.
Idealne dla:
📈 Podążających za trendem – Identyfikują silne trendy z minimalnym opóźnieniem.
📉 Traderów swingowych – Wykrywają odwrócenia rynku wcześniej niż standardowe średnie kroczące.
💹 Skalperów – Uzyskują szybkie informacje o krótkoterminowych zmianach momentum.
QWMA to potężne narzędzie dla traderów poszukujących równowagi między gładkością a responsywnością, co czyni je odpowiednim dla różnych rynków finansowych, w tym akcji, forex i handlu kryptowalutami. 🚀
Podsumowanie
Opinie klientów
5 | 0 % | |
4 | 100 % | |
3 | 0 % | |
2 | 0 % | |
1 | 0 % |