
Mô tả
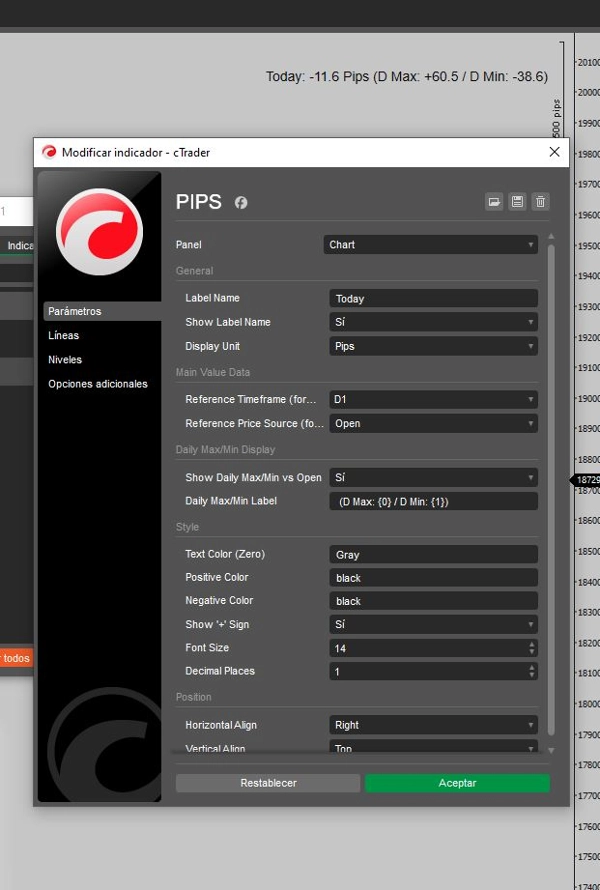
Kịch bản này được thiết kế cho các nhà giao dịch tìm kiếm phân tích thời gian thực về hành động giá liên quan đến các mức quan trọng hàng ngày. Nó tính toán và hiển thị khoảng cách pip giữa giá hiện tại và mức cao, thấp, và mở cửa hàng ngày trên biểu đồ của bạn.
Tính năng chính:
- Dữ liệu thời gian thực: Cung cấp khoảng cách pip thời gian thực từ giá hiện tại đến mức cao, thấp, và mở cửa hàng ngày.
- Độ rõ ràng trực quan: Cung cấp hiển thị sạch sẽ và tối giản, loại bỏ sự lộn xộn không cần thiết trên biểu đồ.
- Đa năng: Hoàn hảo cho các nhà giao dịch lướt sóng, giao dịch trong ngày và giao dịch swing, nâng cao quyết định tại các mức giá quan trọng.
- Hiệu suất hiệu quả: Nhẹ và tối ưu cho việc thực thi nhanh, đảm bảo tích hợp liền mạch vào quy trình giao dịch của bạn.
Lợi ích:
- Quyết định thông minh: Đánh giá nhanh vị trí thị trường so với các mức quan trọng hàng ngày.
- Tiết kiệm thời gian: Truy cập ngay lập tức dữ liệu giá quan trọng mà không cần điều hướng qua nhiều công cụ.
- Tùy chỉnh: Lý tưởng cho các nhà giao dịch tìm kiếm một cách cá nhân hóa, không gây phiền nhiễu để theo dõi các mức giá.
Tóm tắt
Tóm tắt AI
Pips V4Final is a trading indicator that provides real-time analysis of price action relative to key daily levels. It calculates and displays the pip distance between the current price and the daily high, low, and open directly on the chart. The indicator features a clean, minimalist interface designed to reduce chart clutter, making it suitable for scalpers, day traders, and swing traders. It is lightweight and optimized for fast execution, allowing seamless integration into various trading workflows. Users can quickly assess market positioning at critical price points, saving time by accessing essential price data instantly. The tool is customizable, offering a non-intrusive way to monitor important daily price levels for informed decision-making.
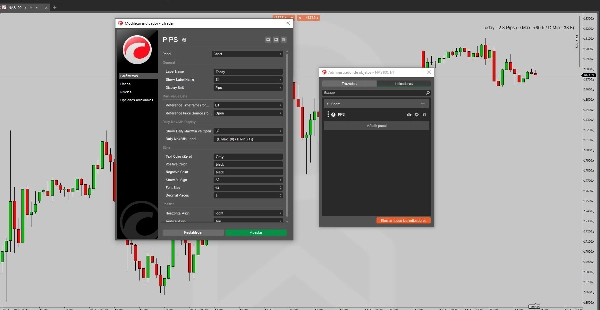
Hồ sơ chỉ báo
Đánh giá của khách hàng
4.5
Đánh giá: 2
5 | 50 % | |
4 | 50 % | |
3 | 0 % | |
2 | 0 % | |
1 | 0 % |
Thảo luận
Câu hỏi thường gặp
Các sản phẩm có sẵn trên cTrader Store, bao gồm bot giao dịch, chỉ báo và plugin, được cung cấp bởi các nhà phát triển bên thứ ba và chỉ nhằm mục đích cung cấp thông tin và tiếp cận kỹ thuật. cTrader Store không phải là nhà môi giới và không cung cấp lời khuyên đầu tư, khuyến nghị cá nhân hay bất kỳ đảm bảo nào về hiệu suất trong tương lai.
Sản phẩm khác của tác giả này


![Logo "High-Low Divergence [Iridio Capital]"](https://cdn.ctrader.com/image/webp/443c4661-7abb-40f1-842f-4b6ec560649b_40914)


![Logo "[Stellar Strategies] Market Session Ultimate"](https://cdn.ctrader.com/image/webp/61ffd537-0125-4246-9e72-42eca1791d64_28232)

Giá
Kể từ 13/01/2025
2
Lượt bán