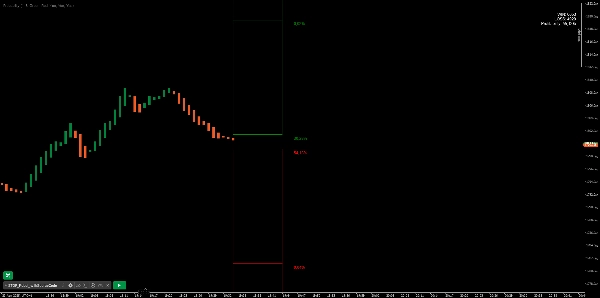
BreakOut_Probability_Expo
Indicator
381 downloads
Version 1.0, Apr 2025
Windows, Mac
5.0
Reviews: 1
"BreakOut_Probability_Expo" uploaded image"BreakOut_Probability_Expo" uploaded image"BreakOut_Probability_Expo" uploaded image"BreakOut_Probability_Expo" uploaded image
Since 09/01/2025
9.43K
Free installs

Breakout Probability is a valuable indicator that calculates the probability of a new high or low and displays it as a level with its percentage. The probability of a new high and low is backtested, and the results are shown in a table— a simple way to understand the next candle's likelihood of a new high or low. In addition, the indicator displays an additional four levels above and under the candle with the probability of hitting these levels.

The indicator helps traders to understand the likelihood of the next candle's direction, which can be used to set your trading bias.


█ Calculations

The algorithm calculates all the green and red candles separately depending on whether the previous candle was red or green and assigns scores if one or more lines were reached. The algorithm then calculates how many candles reached those levels in history and displays it as a percentage value on each line.


█ Example

In this example, the previous candlestick was green; we can see that a new high has been hit 72.82% of the time and the low only 28.29%. In this case, a new high was made.

5.0
Reviews: 1
5
100 %
4
0 %
3
0 %
2
0 %
1
0 %
Customer reviews
August 18, 2025
Clear probability display, effective for breakout strategies, customizable. Cons: No alerts, no MTF mode, possible delays on big history.
Breakout

More from this author

Cumulative delta candles + volume profile
Support and Resistance.
Scalpers Volume Profile
Supply and Demand Zones
Indicator
Grid
NAS100
NZDUSD
+17
Volume Profile Supply Demand
Robust Cumulative delta,Atr and imbalance indicator.
Indicator
NAS100
NZDUSD
XAUUSD
+13
This Indicator will show you Direction, Distance, and Time;
Multi Timeframe Candle drawing. Draw Any candles from any timeframe on your chart :-)

You may also like

Indicator
Grid
NAS100
NZDUSD
+15
The FZ indicator draws Fibonacci channel zones based on the highest and lowest prices over a user-defined period.
Indicator
NAS100
RSI
NZDUSD
+17
Institutional liquidity map for XAUUSD. Spot stop hunts, find the next target, and get a full trade setup automatically.
Indicator
Grid
NAS100
NZDUSD
+13
PhantomGrid draws clear grid levels to help spot entries, exits, and key price zones with ease.
Indicator
Indices
Prop
Stocks
+3
Visualize the four major trading sessions with color-coded rectangles showing session high/low ranges.
Indicator
NAS100
RSI
NZDUSD
+14
Scalping & Swing signals in one. Smart S/R, Auto SL/TP, HTF panel. No repainting. Built for serious traders.
Indicator
NAS100
NZDUSD
XAUUSD
+10
Sero is a stochastic-based momentum oscillator that gives clear, color-coded visual signals for market momentum shifts.
Indicator
NAS100
Breakout
XAUUSD
+6
GUPPY TREND MASTER V3.. Visualize Market Sentiment with the 38-EMA Rainbow The Guppy Trend Master 4X4 Indicator
Indicator
Grid
NAS100
NZDUSD
+19
Session Volume Profile
Indicator
Indices
Signal
AI
🔥 THIS BURNS JP225 INDICATOR – Professional Trading Signals
Indicator
Grid
Indices
XAUUSD
+6
Follow The Trend cBot - INDICATOR - displays two Moving Average Bands for cBot or for your own use
Indicator
NAS100
XAUUSD
Commodities
+3
Advanced price tracking for cTrader featuring a hybrid smooth-motion engine and fully customizable focus reticle
Indicator
RSI
XAUUSD
Commodities
+3
AI-powered KNN machine learning indicator for cTrader. Features dynamic ATR targets, trend filters & Telegram alerts.
Since 09/01/2025
9.43K
Free installs