
Seasonality and Time-of-Day Indicators
Find seasonality and time-of-day indicators for cTrader that reveal recurring patterns by hour, day and month. Highlight the best trading windows, session tendencies and seasonal biases to time entries and avoid dead zones. A useful edge for intraday and swing traders building data-driven routines on Forex, indices and commodities.
Tools
Tool comparison
FAQ
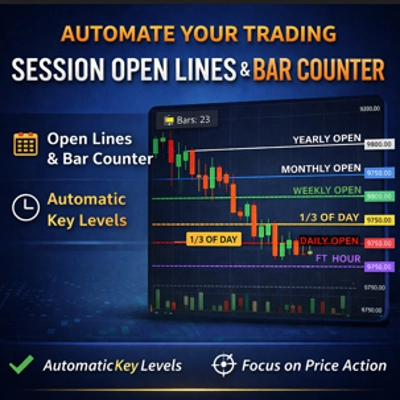

Tool comparison
Product | Reviews | Downloads | Sales | Price | Compatible platforms |
|---|---|---|---|---|---|
Tsunami Volume Surge - RVOL | 4.8 (4) | — | 3 | $25 | Windows, Mac |
Sessions | 5.0 (4) | — | 3 | $19 | Windows, Mac |
Session Open Lines and Bar Counter | 4.8 (5) | — | 2 | $26 | Windows, Mac |
Sessions with OR | 4.5 (2) | — | 2 | $19 | Windows, Mac |
RVI | 4.3 (3) | — | 1 | $19 | Windows, Mac |
Sessions Suite | 4.5 (2) | — | 1 | $29 | Windows, Mac |
UNO MARKET SESSIONS | 4.3 (3) | — | — | $19 | Windows, Mac |
FAQ
A seasonality indicator averages how a market behaved in the same calendar slot across past years, such as each month or week, and plots the typical direction or change. Time-of-day versions apply the same idea to hours, often showing average range per hour.
The time zone, and how it handles daylight saving, decides which hour each bar falls into, while the lookback sets how many days feed each average. Choosing range, absolute change or direction as the measure gives different pictures of the same hours.
Each calendar slot rests on a limited number of past years, so one unusual year can dominate the average, and rate regimes and market conditions change. A tendency on the chart describes the past and can fail in any year, so acting on it carries a real risk of loss.
Seasonality is usually treated as background: a month or hour with a historical tendency is checked against today's trend, levels and news calendar rather than acted on alone. When the two conflict the live chart tends to take priority, and the indicator itself places no orders.
Some sellers offer trials, which may cap features or duration; load one on a Windows or Mac copy of cTrader and compare its statistics with the chart. Also check how much price history your broker provides for the symbol, since short histories make seasonal averages thin.