Descrizione
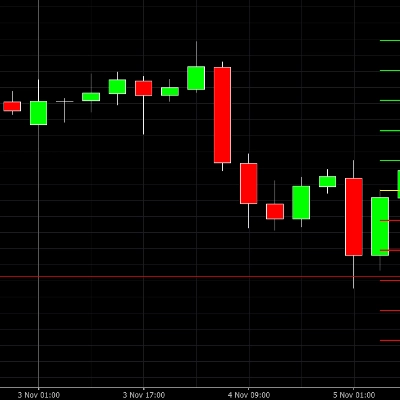
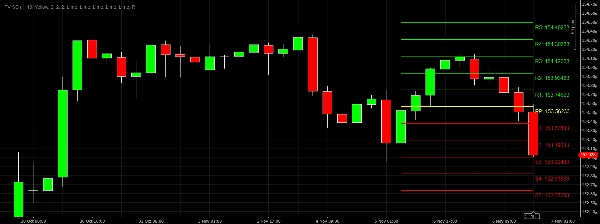
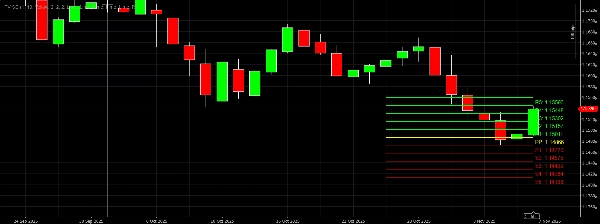
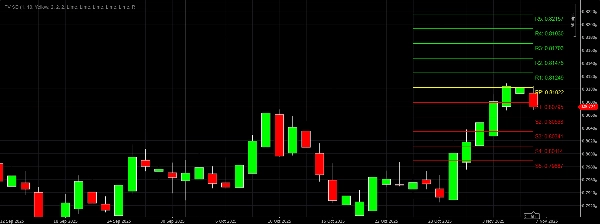
Indicatore Professionale Pivot Points che utilizza la Deviazione Standard, con 5 livelli di supporto (S1–S5) e 5 livelli di resistenza (R1–R5), completamente personalizzabile. Funziona su tutti i timeframe e si aggiorna solo dopo la chiusura della candela.
Descrizione Completa:
Questo potente indicatore calcola i Pivot Points utilizzando la Deviazione Standard per fornire livelli precisi di supporto e resistenza per qualsiasi grafico. È completamente personalizzabile e progettato per chiarezza e facilità d'uso.
Caratteristiche:
- Supporta tutti i timeframe: 5m, 15m, 30m, 1H, 2H, 4H, 6H, 8H, 12H, Giornaliero, Annuale.
- 5 livelli di resistenza (R1–R5) e 5 livelli di supporto (S1–S5), più il Pivot Point (PP).
- Colori personalizzabili per ogni livello tramite menu a tendina.
- Lunghezza della linea regolabile in base al numero di candele (
LineLength). - Spessore della linea regolabile per le linee Pivot, Supporto e Resistenza.
- Aggiorna i livelli solo dopo la chiusura della candela, evitando movimenti durante la formazione.
- Etichette su ogni linea che mostrano nome e prezzo..
- Design pulito e professionale adatto a tutti i tipi di trading: Forex, Azioni, Cripto e CFD.
Come Usare:
- Applica l'indicatore al tuo grafico.
- Imposta Moltiplicatore per controllare il calcolo della Deviazione Standard..
- Scegli i colori per ogni livello usando i menu a tendina.
- Regola lo spessore della linea secondo necessità.
- L'indicatore si aggiorna automaticamente dopo la chiusura di ogni candela.
Perfetto per:
- Identificare i principali livelli di supporto e resistenza.
- Fare trading su qualsiasi timeframe.
- Combinare i Pivot Points con la Deviazione Standard per entrate e uscite più precise.
Riepilogo
Profilo indicatore
Recensioni dei clienti
0.0
Recensioni: 0
Recensioni dei clienti
Questo prodotto non ha ancora ricevuto recensioni. L'hai già provato? Fallo sapere agli altri per primo!
Discussioni
Domande frequenti
Forex
Scalping
XAUUSD
USDJPY
I prodotti disponibili tramite cTrader Store, inclusi bot di trading, indicatori e plugin, sono forniti da sviluppatori terzi e resi disponibili esclusivamente a scopo informativo e di accesso tecnico. cTrader Store non è un broker e non fornisce consulenze in materia di investimento, raccomandazioni individualizzate o garanzie di risultati futuri.


Prezzo
Da 15/10/2025