"Delta Footprint" logosu
Delta Footprint
"Delta Footprint" yüklenen resmi
Başlangıç 15/01/2025
6
Satışlar
Deneme sürümü hakkında
Limited

Professional Footprint & Delta Indicator for cTrader

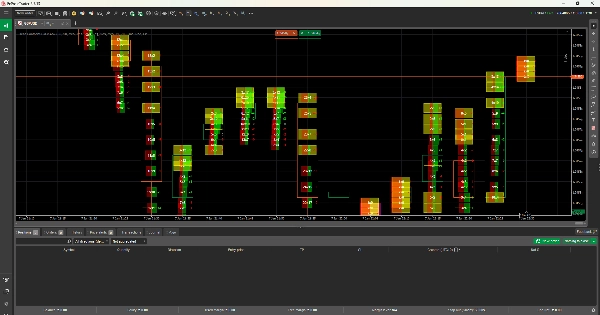
This Footprint Indicator for cTrader reads real tick data to show how buyers and sellers interact at every price level. It displays volume, bid/ask delta, and imbalances, helping traders clearly see who is in control of the market.

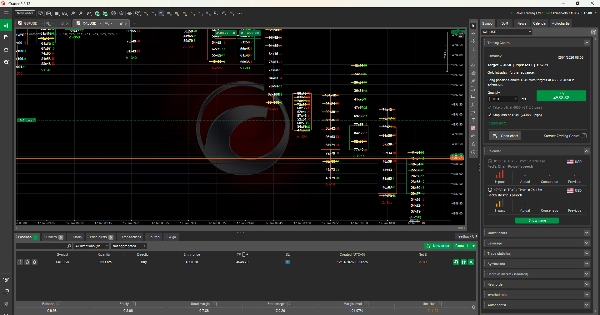
Built using Market Profile and Volume Profile concepts, the indicator highlights areas of high activity, value zones, and strong support or resistance. Instead of guessing from price alone, traders can make decisions based on real traded volume and order flow.

Perfect for scalping and intraday trading, this tool gives cTrader users a professional edge by revealing the true story behind price movement.

This indicator helps you understand what really happens inside each candle. It reads tick data and shows how many buyers and sellers traded at every price.

You can clearly see:

  • Where buyers are stronger
  • Where sellers are stronger
  • When momentum is increasing or slowing down

The indicator also shows delta, which means the difference between buying and selling pressure. It is built using Market Profile and Volume Profile, so you can easily spot important price areas where the market reacts.

This makes trading easier for beginners because you don’t have to guess. You can see real volume and real market activity, not just indicators based on price.


Deneme sürümü hakkında
Limited
Indicator profile
0.0
Değerlendirmeler: 0
Müşteri değerlendirmeleri
Bu ürün için henüz bir değerlendirme yok. Ürünü denediniz mi? O zaman ona dair görüşlerini paylaşan ilk kişi olun!
BTCUSD
Forex
Signal
Breakout
Indices
EURUSD
Commodities
GBPUSD
NZDUSD
Martingale
Scalping
Supertrend
SMC
Crypto
Grid
AI
Stocks
XAUUSD
NAS100
Fair Value Gap (FVG)
USDJPY
Products available through cTrader Store, including trading bots, indicators and plugins, are provided by third-party developers and made available for informational and technical access purposes only. cTrader Store is not a broker and does not provide investment advice, personal recommendations or any guarantee of future performance.

Bu oluşturanın diğer ürünleri

VWAP with standard deviation bands. Fully customizable colors, periods, and multipliers for precise trading signals
Footprint volume indicator showing bid/ask splits at each price level
"Footprint Chart: Visualize bid-ask volume inside candles for clearer order flow and market depth insights."
Pro trading dashboard: WVAP analysis + Volume Profile + Neural AI tracking + News alerts. All-in-one tool!
RSI Grid System with 200 EMA filter combining momentum, grid distance, and trend alignment for precision entries.
Session Volume Profile
Market Profile maps price vs. time to reveal where value is accepted (VAH/VAL) and rejected (POC), helping traders fade
"Advanced forex bot combining RSI, London Breakout & Swing strategies with pro risk management & live performance
Read the market with AI: live sentiment, news impact, equity, spread & neural net signals in one dashboard.
Trading system combining Elliott Wave analysis with Bollinger Bands and multiple safety features

Şunları da beğenebilirsiniz

ICT Order Block Advanced
Average price calculator for multi-position management. Real-time break-even level with smart visuals.
Tick Imbalance Bars Indicator - brings institutional-grade market microstructure analysis to cTrader.
Fractal MSS with 4H Bias is a smart market-structure indicator designed to detect: Market Structure Shifts (MSS)
cTrader indicator with multi-pattern detection: trend, FVG, gaps, inside bars, 123, pin bars and more.
Customize color
ADVANCED ICT + ADR + AWR SUITE PRO (The Ultimate All-in-One Toolkit for Price Action Traders)
Key NY session opens for NASDAQ (US100) & SP500 to find Tick Precise Entrys for High R:R intraday setups.
ATR Ratio SuperTrend show Trend & volatility combined. Clean arrows, built-in Take Profit.
Logarithmic Framework by LudwigICT
Volatility-weighted cloud with adaptive bands and UP/DOWN tags for timing trends, pullbacks, and breakouts.
🔹 Trend-Reversal-Indicator for cTrader 🔹 The ultimate Renko chart tool!
cTreder Smart SMA
Customizable multi-timeframe pivot point indicator for cTrader with alerts, Fibonacci, CPR, and more!
📊 Liquidation Map: Potential areas where highly leveraged investors might face liquidations.
VegaXLR's cTrader StochRSI identifies overbought/oversold RSI levels for precise trade entries.
Pattern Detector With Signal Buy and Sell
Identify high-probability reversal zones by detecting SMT divergences between correlated pairs in real time
Başlangıç 15/01/2025
6
Satışlar