
Descrição
Indicador Time To Break Even v2
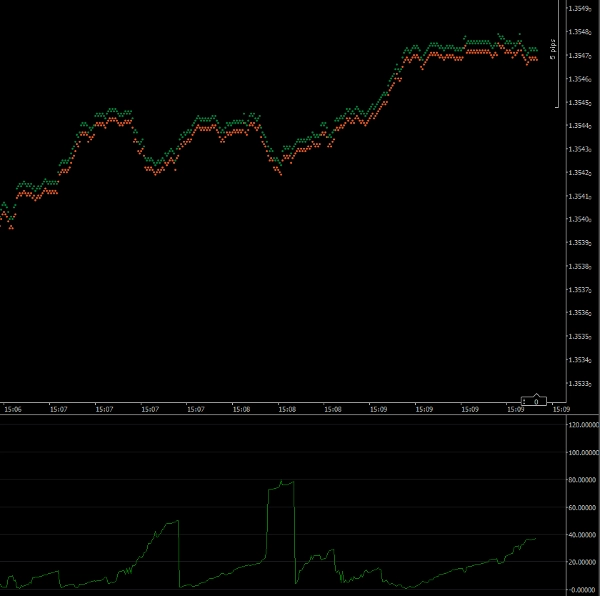
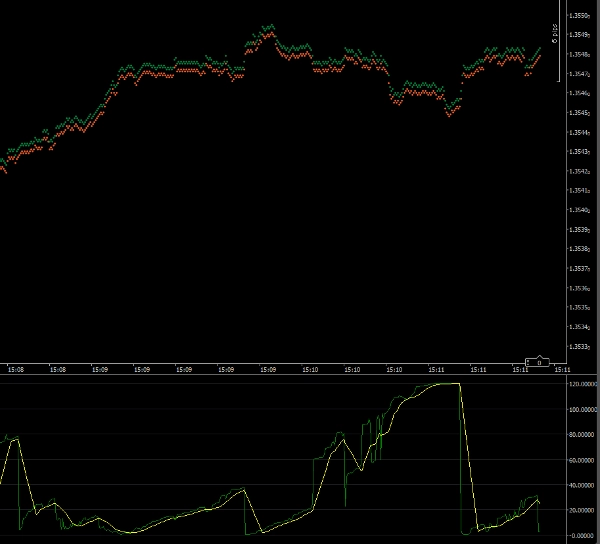
Este indicador ajudará você a cronometrar a entrada da sua negociação no mercado. O gráfico mostra o provável número de segundos para sua negociação atingir o ponto de equilíbrio. Se o mercado estiver se movendo rápido e na sua direção, o indicador mostrará um número pequeno. Se o mercado estiver se movendo contra você ou lentamente, o número será maior.
O indicador calcula o número de pips que sua negociação precisa para atingir o ponto de equilíbrio. Em seguida, compara isso com a velocidade atual com que o preço está se movendo.
N.B. Este indicador deve ser executado no Time Frame de 1 Tick.
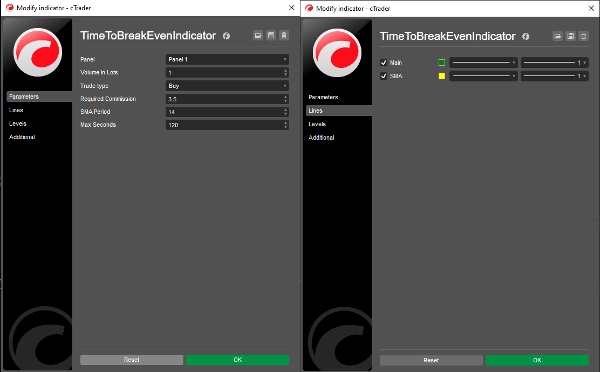
Parâmetros
Volume em Lotes: O volume da sua negociação proposta
Tipo de Negociação: Se sua negociação será de compra ou venda
Comissão Necessária: A comissão que sua negociação incorrerá (você pode obter isso na janela Quick Trade)
Período SMA: O período do gráfico da Média Móvel Simples (padrão = 14)
Segundos Máximos: O número máximo de segundos que será registrado (veja abaixo)
Linhas
Principal: A linha do gráfico do indicador (padrão = verde)
SMA: A linha do gráfico da Média Móvel Simples (padrão = amarelo)
Segundos Máximos
Permitir que o indicador exiba valores muito grandes significa que a escala do indicador impedirá que você veja os detalhes quando o tempo para atingir o ponto de equilíbrio for pequeno. Definir este parâmetro permite que você defina a escala máxima do indicador. Por padrão, está definido para 120 (2 minutos). Portanto, qualquer resultado de 2 minutos ou mais será plotado como 120 segundos.
Dr Andy Larkin
Copyright 2025, Todos os Direitos Reservados
26 de Maio de 2025
Legal
Os resultados deste indicador devem ser verificados quanto à precisão antes de serem usados em negociações ao vivo.
Nenhuma garantia é dada ou implícita para os resultados deste indicador.
Nenhuma responsabilidade é aceita por quaisquer perdas incorridas como resultado do uso deste indicador.
Resumo
Avaliações de clientes
5 | 50 % | |
4 | 50 % | |
3 | 0 % | |
2 | 0 % | |
1 | 0 % |


