
50 percent
Indicador
Versão 1.0, Aug 2025
Windows, Mac
5.0
Avaliações: 2

Descrição
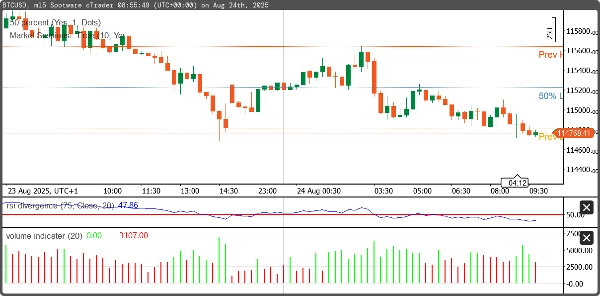
Este cBot detecta automaticamente os preços máximos e mínimos da sessão anterior e calcula o ponto médio entre eles. Ele foi projetado para ajudar os traders identificando zonas-chave de suporte/resistência e níveis de equilíbrio de mercado, que são frequentemente usados para estratégias de reversão ou rompimento.
- Detecta a máxima e mínima do dia (ou sessão) anterior.
- Calcula o ponto médio entre a máxima e a mínima.
- Plota os níveis de máxima, mínima e ponto médio no gráfico.
Resumo
Perfil do indicador
Avaliações de clientes
5.0
Avaliações: 2
5 | 100 % | |
4 | 0 % | |
3 | 0 % | |
2 | 0 % | |
1 | 0 % |
Avaliações de clientes
August 29, 2025
The screen feels less crowded, but the final call still needs say no.
August 20, 2025
Conversa
Perguntas frequentes
Os produtos disponíveis através da cTrader Store, incluindo bots de negociação, indicadores e plugins, são fornecidos por programadores terceiros e são disponibilizados apenas para fins informativos e de acesso técnico. A cTrader Store não é um corretor e não fornece aconselhamento em matéria de investimento, recomendações pessoais ou qualquer garantia de desempenho no futuro.
Mais deste autor


Preço
Desde 14/05/2025
10.1M
Volume negociado
81.44K
Pips ganhos
205
Instalações gratuitas