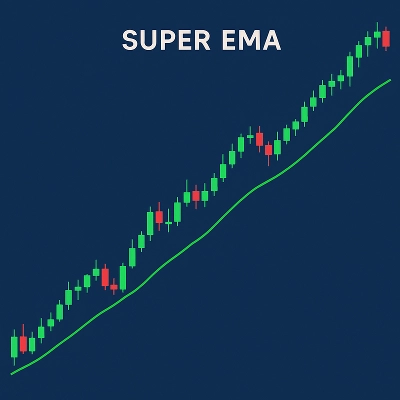
Super EMA
Indicador
Versão 1.0, Oct 2025
Windows, Mac
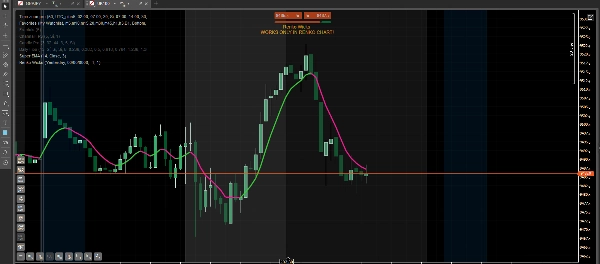
Cansado de médias móveis que atrasam e não dão sinais claros?
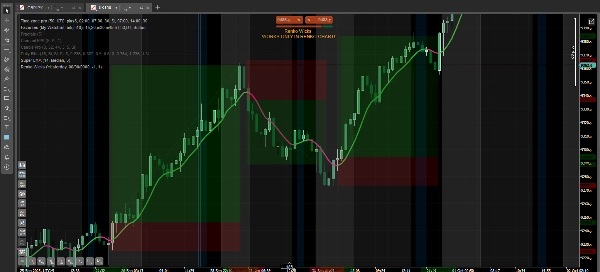
Super EMA colore a tendência em tempo real para que você possa ver instantaneamente quem está no controle:
- 🟩 Verde → momentum de alta
- 🟥 Rosa → pressão de baixa
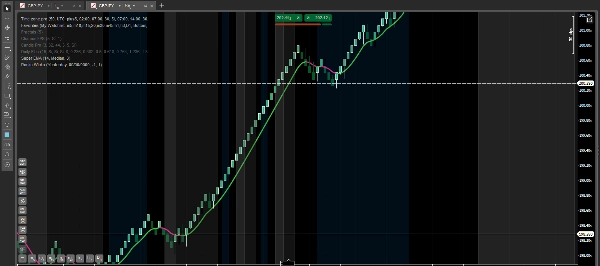
Sua dupla suavização corta o ruído, oferecendo uma linha limpa, reativa e confiável para identificar mudanças de direção, filtrar entradas e aproveitar oscilações com confiança.
Funciona em qualquer símbolo e período. Perfeito para scalpers, day traders e swing traders que desejam uma visão clara e direta da tendência.
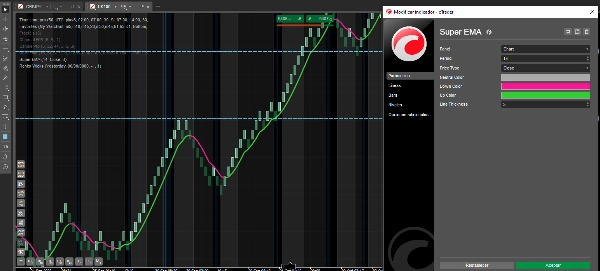
Perfil do indicador
0.0
Avaliações: 0
Avaliações de clientes
Ainda não há avaliações para este produto. Já o experimentou? Seja o primeiro a contar a outras pessoas!
Forex
Signal
Indices
Crypto
Stocks
Os produtos disponíveis através da cTrader Store, incluindo bots de negociação, indicadores e plugins, são fornecidos por programadores terceiros e são disponibilizados apenas para fins informativos e de acesso técnico. A cTrader Store não é um corretor e não fornece aconselhamento em matéria de investimento, recomendações pessoais ou qualquer garantia de desempenho no futuro.


![Logótipo de "[Stellar Strategies] Market Session Ultimate"](https://cdn.ctrader.com/image/webp/61ffd537-0125-4246-9e72-42eca1791d64_28232)


Desde 24/02/2025
13
Vendas
1.7K
Instalações gratuitas