
Açıklama
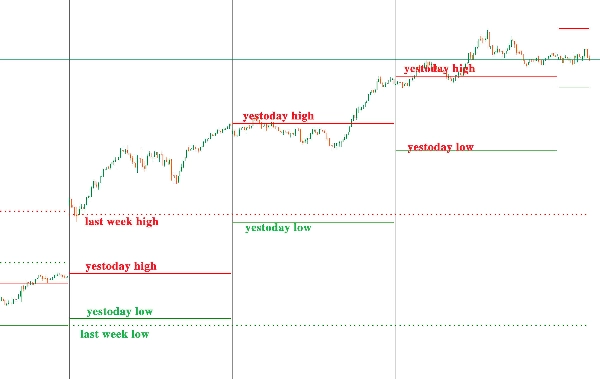
"Günlük Seviyeler" göstergesi, farklı zaman dilimlerinde geçen haftanın yüksek/düşük ve dünün yüksek/düşük seviyelerini göstermek için kullanılır.
Geçen haftanın yüksek/düşük seviyesi: Kalın kesikli çizgilerle işaretlenmiştir;
Dünün yüksek/düşük seviyesi: İnce düz çizgilerle işaretlenmiştir.
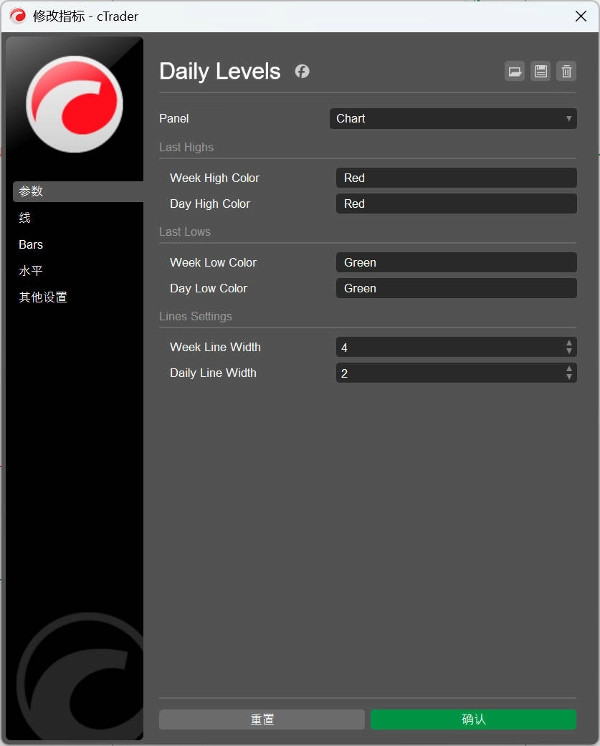
Kullanıcılar renkleri ve çizgi kalınlığını özelleştirebilir.
“Daily Levels”指标用于在不同的时框框架下显示上周最高价/最低价和昨天最高价/最低价。
上周最高/最低价:使用粗虚线标注;
昨天最高/最低价:使用细实线标注。
用户可以自定义颜色和线条粗细。
Özet
Gösterge profili
Müşteri değerlendirmeleri
0.0
Değerlendirmeler: 0
Müşteri değerlendirmeleri
Bu ürün için henüz bir değerlendirme yok. Ürünü denediniz mi? O zaman ona dair görüşlerini paylaşan ilk kişi olun!
Tartışma
SSS
Forex
Signal
Breakout
Indices
Commodities
Crypto
cTrader Store üzerinden erişilebilen işlem botları, göstergeler ve eklentiler gibi ürünler, üçüncü taraf sağlayıcılar tarafından sağlanır ve yalnızca bilgilendirme ve teknik erişim amaçlarıyla sunulur. cTrader Store bir broker değildir ve yatırım tavsiyesi, kişisel öneriler vermez veya gelecekteki performansı garanti etmez.


Fiyat
Başlangıç 30/09/2024
44
Satışlar