

Descrição
🚀 Risk Appetite & Directional Bias ULTRA (cTrader) é um indicador profissional de regime de mercado projetado para medir Risk-On / Neutral / Risk-Off e convertê-los em um viés direcional claro e acionável. Em vez de depender de um único mercado, ele compara dois instrumentos (um “proxy de risco” e um “benchmark”) para construir um Score de Risco (0–100) em tempo real, destacar transições de regime e resumir tudo por meio de um painel de controle no gráfico.
🔧 O que os dois primeiros parâmetros significam (e por que são importantes)
🟠 Símbolo do Ativo de Risco (BTC)
Este é o proxy de risco—o instrumento usado como “termômetro do apetite ao risco.” Está rotulado como “BTC” porque o conceito original usa Bitcoin como proxy global de risco-on, mas você não é obrigado a usar Bitcoin. Você pode configurá-lo para qualquer ativo que represente bem o sentimento de risco (por exemplo, BTC, NASDAQ/US100, índices de beta alto, etc.).
🔵 Símbolo de Referência (SP/US500)
Este é o mercado de referência (benchmark) que você deseja acompanhar para o viés macro. Normalmente é US500/SPX500, mas pode ser qualquer instrumento que você considere seu principal “motor de contexto.”
✅ Em resumo:
- Ativo de Risco = sensor de sentimento (fonte do apetite ao risco)
- Benchmark = mercado de referência que você quer que o viés reflita
❓ Tenho que usar no Bitcoin?
Não. Você pode usar o indicador de diferentes maneiras dependendo do seu objetivo:
✅ A) Macro “clássico” Risk-On/Risk-Off (recomendado)
- Ativo de Risco: BTCUSD
- Benchmark: US500 / SPX500
Isso oferece uma visão clara dos regimes globais de risco.
✅ B) Negociando Bitcoin com contexto macro
- Ativo de Risco: BTCUSD
- Benchmark: US500 (ou outra referência macro)
Isso ajuda a entender quando as condições macro apoiam ou se opõem ao BTC.
✅ C) Relações multiativos / mercado personalizado
- Ativo de Risco: BTC ou US100
- Benchmark: o mercado que você quer filtrar (GER40, XAUUSD, etc.)
Isso transforma o indicador em um “motor de sentimento” flexível.
⚙️ Como funciona (lógica principal)
O modelo calcula o seguinte em ambos os símbolos:
📈 Retornos (%) (opcionalmente logarítmicos para mais estabilidade)
📊 Volatilidade (desvio padrão sobre o período selecionado)
🔗 Correlação móvel entre as duas séries de retorno
🎛️ Peso Dinâmico que ajusta a influência do proxy de risco com base em:
- força da correlação
- volatilidade relativa
Isso produz um sinal de Mudança Ajustada que é:
- suavizado por EMA
- normalizado em um Score de Risco 0–100
📊 Como ler (os sinais mais importantes)
🎯 Score de Risco (0–100) é sua bússola principal:
🟢 Risk-On (pontuação acima do limite superior, por exemplo, > 60)
→ o apetite ao risco está forte, o ambiente frequentemente favorece ativos de momentum/risco
🔵 Neutro (entre os limites inferior e superior, por exemplo, 40–60)
→ transição / mercado lateral / sinais mistos, filtragem recomendada
🔴 Risk-Off (pontuação abaixo do limite inferior, por exemplo, < 40)
→ ambiente defensivo, cautela maior, risco de queda frequentemente elevado
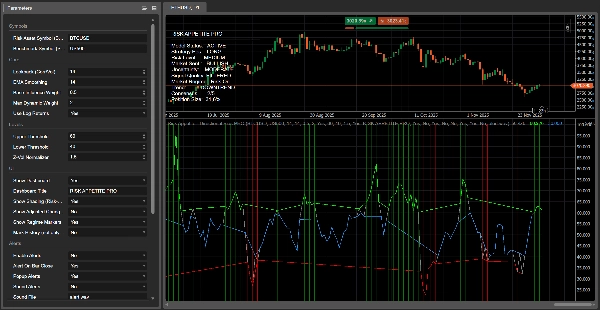
🔴 Por que a linha vermelha “quebra” (e o que isso significa)
Nesta versão ULTRA, a visualização é intencional e “baseada em regime”:
- Uma linha base contínua (cinza) está sempre visível
- Sobreposições coloridas aparecem apenas em seu regime:
-
- Sobreposição vermelha apenas durante Risk-Off
- Sobreposição verde apenas durante Risk-On
- Sobreposição azul durante Neutro
Então, quando o mercado sai do Risk-Off e entra em Neutro (ou Risk-On), a sobreposição vermelha fica vazia (NaN) e o cTrader para de desenhá-la—por isso parece que ela “interrompe.” ✅
📌 Importante: isso não significa automaticamente que a tendência de baixa “acabou.”
Significa que o modelo não detecta mais condições fortes e confirmadas de Risk-Off, então a vantagem baixista é reduzida e o mercado provavelmente está em transição.
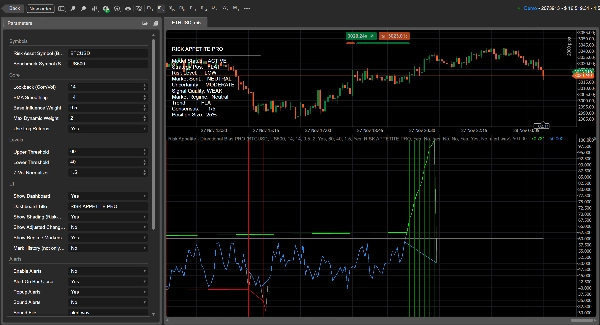
🖥️ Para que serve o display no gráfico (painel) — explicado linha por linha
O painel é seu painel de decisão em tempo real. Ele resume regime, confiança e orientação tática para que você não precise adivinhar apenas pela linha.
✅ Status do Modelo
Mostra se o modelo está funcionando corretamente.
- ATIVO = dados válidos disponíveis e cálculos corretos
- SEM DADOS = dados do símbolo ausentes, nome do símbolo errado ou histórico/alinhamento de tempo insuficiente
🎯 Posição da Estratégia (Strategy Pos)
Uma postura sugerida com base no regime:
- LONGA = Risk-On
- CURTA = Risk-Off
- NEUTRA = Neutro
⚠️ Nível de Risco
Uma medida de intensidade de risco baseada na volatilidade e incerteza do mercado.
- MUITO BAIXO / BAIXO = condições mais estáveis
- MÉDIO = normal
- ALTO / MUITO ALTO = mais ruído, maior risco de whipsaw; reduza o tamanho ou exija confirmação mais forte
🧠 Sentimento de Mercado
Um tom direcional derivado do nível do score:
- ALTISTA / BAIXISTA / NEUTRO
🌫️ Incerteza
Mostra o quão “claro” o modelo está. Aumenta quando:
- a correlação enfraquece, ou
- a volatilidade aumenta (ambiente mais instável)
Níveis: BAIXO / MODERADO / ALTO
🧪 Qualidade do Sinal
Uma classificação combinada baseada em:
- força do sinal (distância de 50)
- nível de incerteza
Resultados: FORTE / FILTRADO / FRACO
🔥 Regime de Mercado
A classificação principal:
- Risk-On / Neutro / Risk-Off
Este é o estado central do regime que direciona as sobreposições de cor, sombreamento e viés de posição.
📉 Tendência
A direção de curto prazo do score (inclinação):
- TENDÊNCIA DE ALTA = apetite ao risco crescente
- TENDÊNCIA DE BAIXA = apetite ao risco decrescente
- LATERAL = movimento lateral / baixo momentum
🗳️ Consenso (X/5)
Uma pontuação simples de alinhamento que conta quantas condições-chave concordam (direção, inclinação, alinhamento de correlação, etc.).
Maior = ambiente mais limpo e consistente.
📏 Tamanho da Posição
Uma sugestão de percentual de exposição baseada na força do sinal e incerteza:
- forte & baixa incerteza → sugestão de tamanho maior
- fraco ou incerto → sugestão de tamanho menor
🧭 Vantagem multi-temporal (muito poderoso na prática)
Quando você analisa o mesmo mercado em múltiplos períodos, o indicador atualiza e realinha por período. Isso facilita identificar:
✅ Alinhamento de período (sinais mais fortes)
✅ Conflito de período (frequentemente condições mais neutras/laterais)
Períodos maiores definem o regime macro, períodos menores ajudam no timing das entradas dentro desse regime.
📌 Marcadores, alertas & notificações (recursos ULTRA)
✨ Marcadores de regime aparecem no gráfico quando o regime muda:
- Risk-On ↔ Neutro ↔ Risk-Off
Isso torna as transições instantaneamente visíveis.
🔔 Alertas & notificações podem ser ativados para que você receba:
- alertas pop-up (e som opcional)
- alertas no fechamento da barra (recomendado para evitar gatilhos falsos enquanto o candle está se formando)
💬 Junte-se ao nosso (otimizações + presets + ferramentas)
Quer o melhor desempenho deste indicador? Junte-se ao nosso Discord para:
✅ otimização de parâmetros para os símbolos do seu corretor
✅ presets prontos para uso (Crypto / Índices / FX)
✅ orientação para configuração multi-temporal
✅ ferramentas avançadas e atualizações que melhoram o filtro de sinais e a qualidade da execução
Resumo
Avaliações de clientes
5 | 100 % | |
4 | 0 % | |
3 | 0 % | |
2 | 0 % | |
1 | 0 % |


