
Descrição
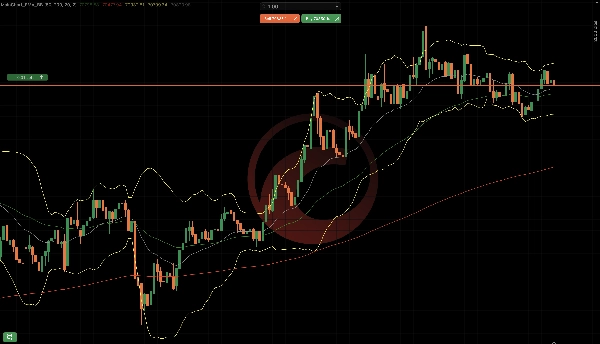
MainChart_EMA_BB é um indicador sobreposto ao gráfico principal para cTrader que combina:
- Médias Móveis Exponenciais (EMA 50 & EMA 200)
- Bandas de Bollinger (Superior / Média / Inferior)
Componentes do Indicador
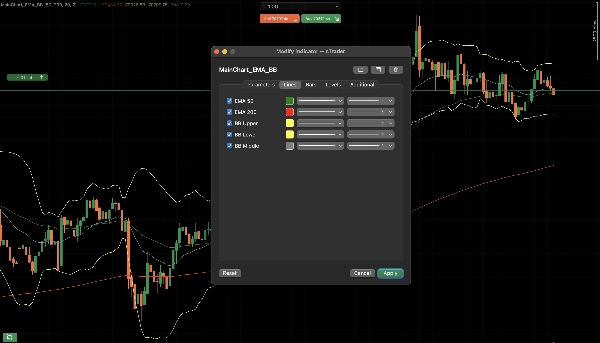
Médias Móveis Exponenciais (EMA)
Duas EMAs estão disponíveis:
EMAPeríodo PadrãoCor Padrão
EMA 50
50
Verde
EMA 200
200
Vermelho
Propósito:
- Direção da tendência
- Suporte/resistência dinâmicos
- EMA 50 acima da EMA 200 → viés de alta
- EMA 50 abaixo da EMA 200 → viés de baixa
Bandas de Bollinger
As Bandas de Bollinger consistem em:
- Banda Superior
- Banda Média (baseada em EMA)
- Banda Inferior
Configurações Padrão:
- Período: 20
- Desvio Padrão: 2.0
- Tipo de MA: Exponencial
Propósito:
- Medição de volatilidade
- Zonas de sobrecompra / sobrevenda
- Preço tocando a banda superior → possível exaustão
- Preço tocando a banda inferior → possível repique
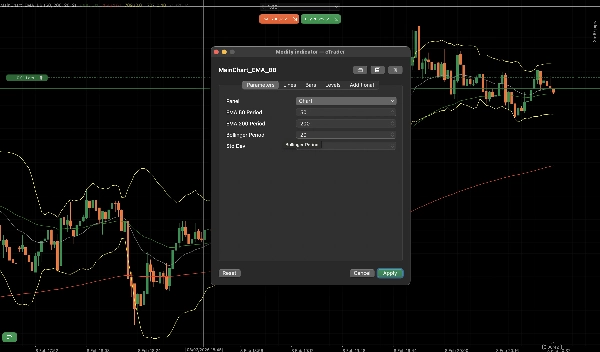
Parâmetros Explicados
Parâmetros da EMA
- Mostrar EMA 50: Ativar/desativar EMA 50
- Período da EMA 50: Período de cálculo
- Mostrar EMA 200: Ativar/desativar EMA 200
- Período da EMA 200: Período de cálculo
Parâmetros das Bandas de Bollinger
- Mostrar Bandas de Bollinger: Ativar/desativar BB
- Período BB: Período de retrocesso
- Desvio Padrão BB: Multiplicador de volatilidade
Uso Típico em Negociação
Confirmação de Tendência
- EMA 50 acima da EMA 200
- Preferir apenas operações longas
Reversão / Retração
- Preço recua para a EMA 50
- Compressão e depois expansão da Banda de Bollinger
O bom deste indicador é que ele é configurável e não há necessidade de configurar múltiplos indicadores.
Resumo
Perfil do indicador
Avaliações de clientes
4.5
Avaliações: 2
5 | 50 % | |
4 | 50 % | |
3 | 0 % | |
2 | 0 % | |
1 | 0 % |
Avaliações de clientes
February 16, 2026
a 1R exit plan makes review easier, and messy areas become easier to avoid.
February 15, 2026
Conversa
Perguntas frequentes
Prop
Forex
Indices
Commodities
Crypto
Stocks
Bollinger
Os produtos disponíveis através da cTrader Store, incluindo bots de negociação, indicadores e plugins, são fornecidos por programadores terceiros e são disponibilizados apenas para fins informativos e de acesso técnico. A cTrader Store não é um corretor e não fornece aconselhamento em matéria de investimento, recomendações pessoais ou qualquer garantia de desempenho no futuro.
Mais deste autor


Preço
Desde 01/04/2025