
Descrição
O Conceito de "Engenharia Reversa"
A grande inovação deste indicador está no seu algoritmo de Engenharia Reversa. Normalmente, um oscilador estocástico pega dados de preço e os transforma em um número entre 0 e 100. Este indicador faz o oposto: ele pega os níveis matemáticos do oscilador e os reprojeta de volta na escala de preço.
Isso permite que o trader traduza um momentum matemático em um nível de preço concreto ($ ou pips) diretamente no gráfico.
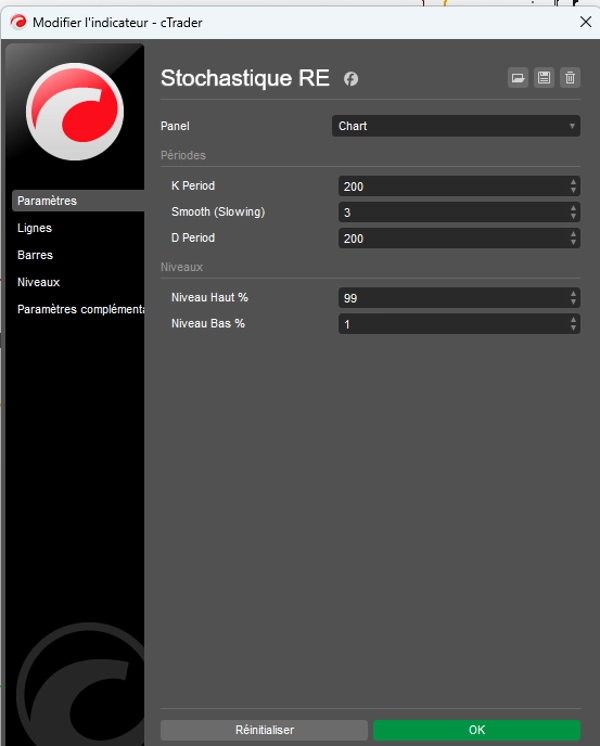
Definindo Limites: o Teto (99%) e o Piso (1%)
Ao contrário das configurações clássicas (80/20), este indicador está configurado por padrão para 1% e 99%. Esta configuração tem um propósito específico: define os limites físicos do preço.
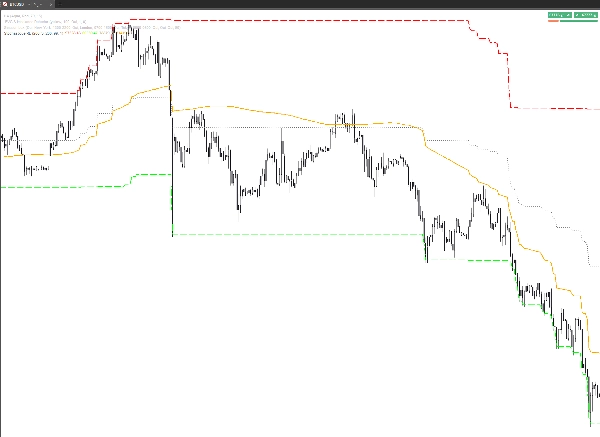
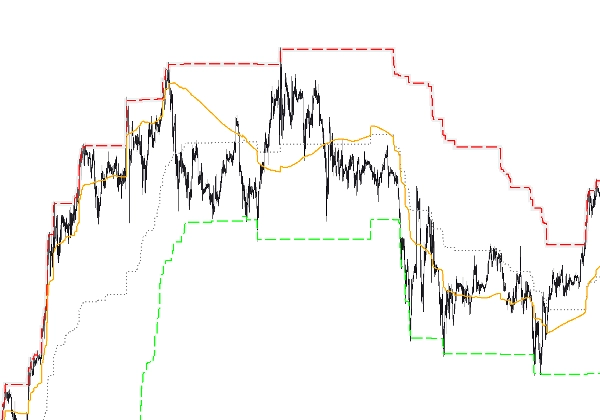
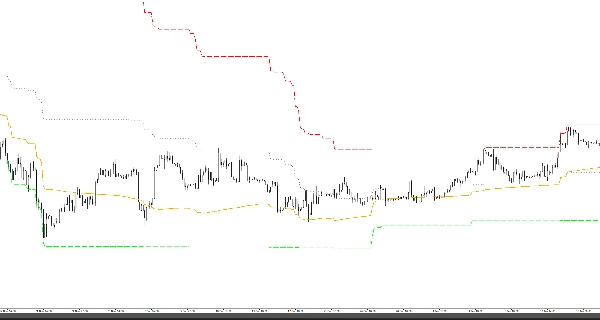
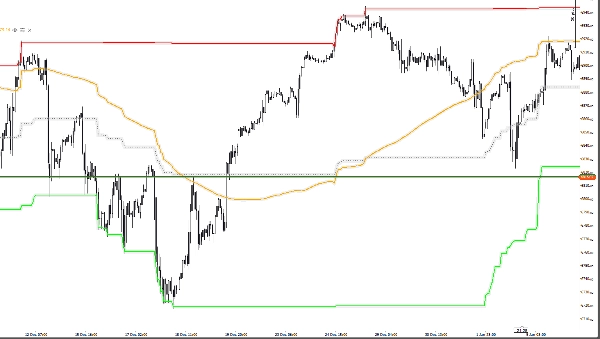
- O Nível de 99% (Teto do Preço): Define o preço mais alto que o mercado pode alcançar antes de ser considerado que esgotou 99% da amplitude do seu movimento durante o período dado. É a "fronteira" do preço.
- O Nível de 1% (Piso do Preço): Define o preço mais baixo, o suporte final do ciclo atual. É o nível onde o preço esgotou 99% da sua capacidade de queda em relação ao seu histórico recente.
Por Que Ele "Define o Preço"?
Graças a este sistema, a linha Sinal Laranja %D não é mais apenas uma curva se movendo no vácuo.
- Localização do Preço: Mostra a localização exata do "preço justo" ponderado pelo seu momentum.
- Mapeamento da Faixa: Transforma o gráfico em um mapa onde você pode ver se o preço atual "vale" 1% ou 99% do seu potencial.
- Alvos Concretos: Se a linha laranja sobe, ela não está apenas buscando alcançar "80"; está buscando alcançar o preço preciso exibido pela linha vermelha (99%).
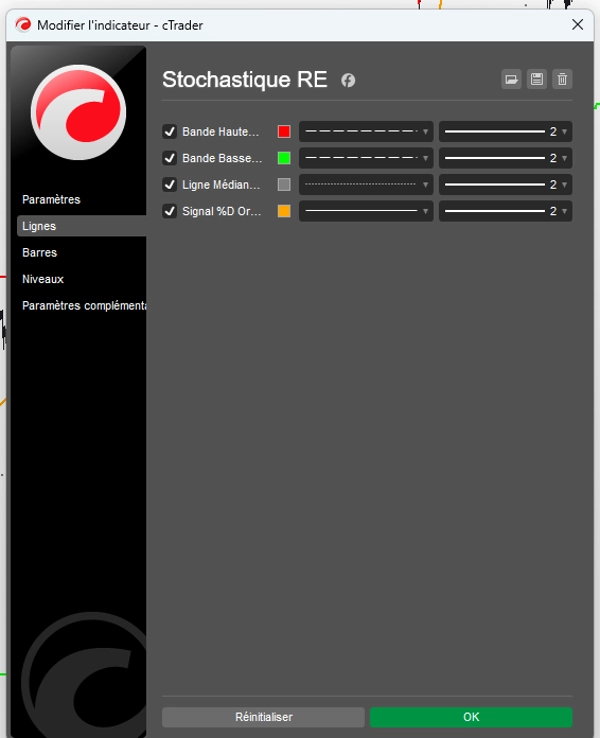
Funções das Linhas (Aba Linhas)
Tudo é personalizável para leitura visual instantânea:
- Banda Superior (99%): O teto teórico do preço.
- Banda Inferior (1%): O piso teórico do preço.
- Linha do Meio (50%): O ponto pivô central, a zona de equilíbrio.
- Sinal Laranja %D: O cursor dinâmico navegando entre o piso e o teto para definir a direção do mercado.
Resumo para o Trader
Este indicador não apenas diz que o mercado está "sobrecomprado"; ele mostra exatamente a que preço o mercado se torna fisicamente caro demais (99%) ou barato demais (1%). É uma ferramenta de precisão que traz a matemática de volta à realidade do livro de ordens.
Resumo
The indicator displays these boundaries directly on the price chart, allowing traders to see exact price levels where the market is considered overbought or oversold. Key features include customizable lines for the upper band (99%), lower band (1%), mid line (50%), and an orange signal %D line that dynamically indicates market direction between these boundaries.
By translating momentum into precise price targets, Stochastique RE helps traders localize fair price zones, map price ranges, and identify concrete price targets rather than abstract oscillator values. It supports various markets including Forex, stocks, commodities, indices, and cryptocurrencies, with symbol tags such as BTCUSD, EURUSD, GBPUSD, XAUUSD, NAS100, and USDJPY.
Avaliações de clientes
5 | 67 % | |
4 | 33 % | |
3 | 0 % | |
2 | 0 % | |
1 | 0 % |


