
Descrição
Bem-vindo ao Indicador ALMA do Regime de Volatilidade!
Está cansado de ser "picado" em mercados laterais? Este indicador é projetado para traders manuais que querem encontrar o "ponto ideal" exato entre compressão do mercado e expansão da tendência.
Em vez de depender de multiplicadores estáticos, esta ferramenta lê os padrões de respiração do mercado. Ela se adapta à volatilidade em tempo real e filtra sinais fracos, garantindo que você veja apenas setups de alta probabilidade.
🌟 As "Coisas Doces" (Principais Características)
- Regime Dinâmico de Volatilidade: Analisa automaticamente a largura da Banda de Bollinger para detectar se o mercado está comprimindo ou expandindo, ajustando a sensibilidade interna do Supertrend em tempo real.
- Filtro de Tendência ALMA: Usa a Média Móvel Arnaud Legoux (ALMA) para validar a tendência geral. Se um sinal de rompimento contradizer a tendência ALMA, o indicador o desbota e o ignora, poupando você de falsos sinais.
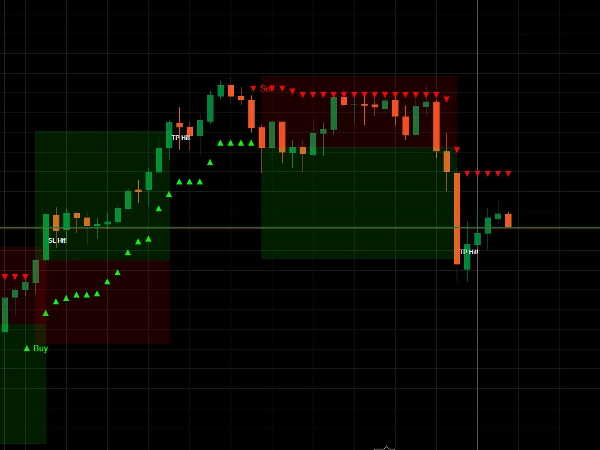
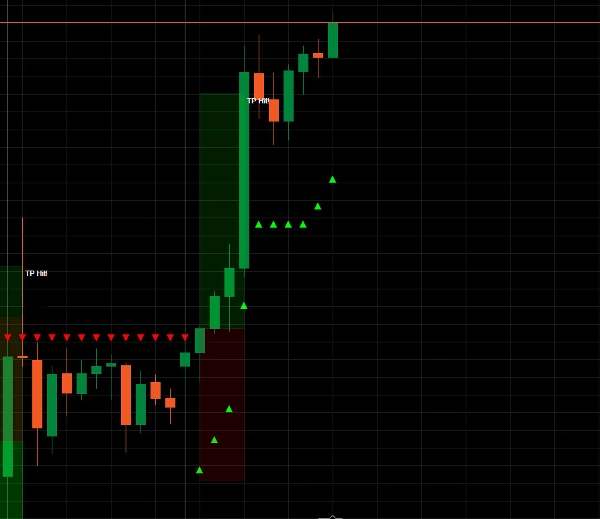
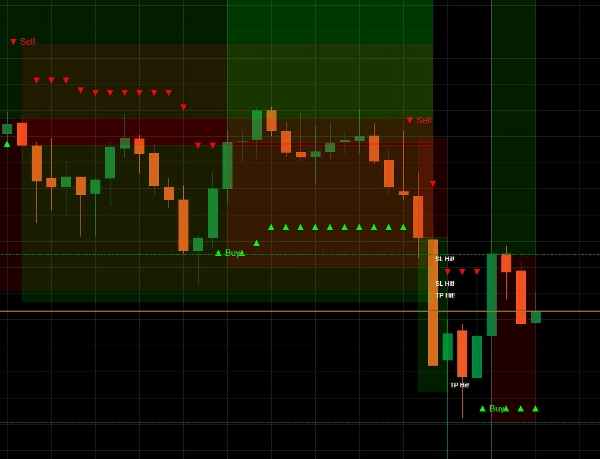
- Zonas Visuais de Alvo: Desenha zonas claras e translúcidas de Take Profit (Verde) e Stop Loss (Vermelho) diretamente no seu gráfico, calculadas dinamicamente usando o Average True Range (ATR).
- Placar Integrado: Um placar em tempo real no gráfico acompanha vitórias teóricas, perdas e taxa de acerto com base em dados históricos do gráfico.
- Zero Repainting: Os sinais são gerados e confirmados somente quando a vela fecha estritamente. O que você vê é o que você obtém.
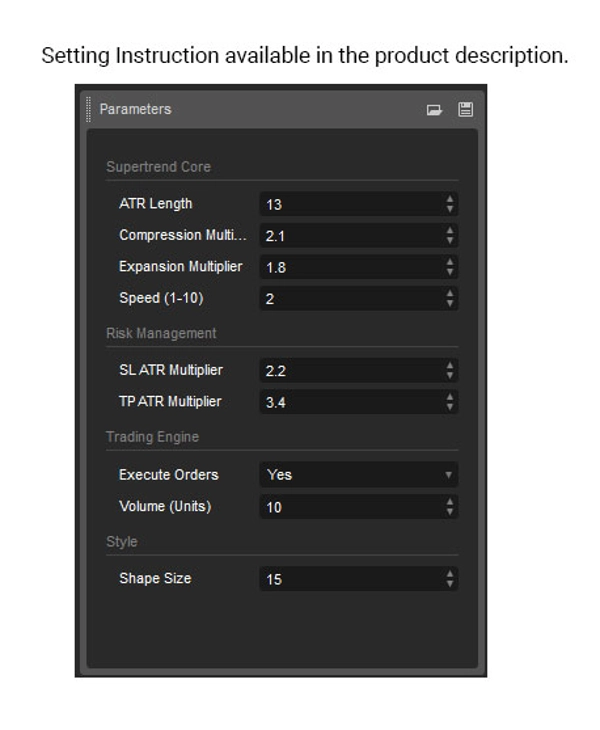
⚙️ Manual do Usuário & Configuração Recomendada
- Anexar ao Gráfico: Arraste e solte no seu timeframe preferido (funciona perfeitamente em M15, H1 e H4).
- Ajustar Risco: Ajuste o
Multiplicador SL ATRe oMultiplicador TP ATRpara combinar com seu estilo pessoal de risco-retorno. - Negocie os Sinais: Espere um texto confirmado "▲ Compra" ou "▼ Venda" aparecer no fechamento de uma vela. Configure suas ordens na corretora para coincidir com as zonas Vermelha (SL) e Verde (TP) pintadas.
⚠️ Aviso de Negociação Este indicador é uma ferramenta de análise visual, não uma bola de cristal. O placar no gráfico representa condições históricas teóricas e não considera spreads individuais de corretoras, slippage ou comissão. Sempre pratique uma gestão de risco adequada e teste em uma conta Demo antes de operar com capital real.
Resumo
Avaliações de clientes
5 | 100 % | |
4 | 0 % | |
3 | 0 % | |
2 | 0 % | |
1 | 0 % |


![Logótipo de "High-Low Divergence [Iridio Capital]"](https://cdn.ctrader.com/image/webp/443c4661-7abb-40f1-842f-4b6ec560649b_40914)


