
Mô tả
https://chartshots.spotware.com/c/695bff3f3bc21
https://chartshots.spotware.com/c/695bffac03fb1
https://chartshots.spotware.com/c/695c0002aabb7
📊 Auto Fib Retracement
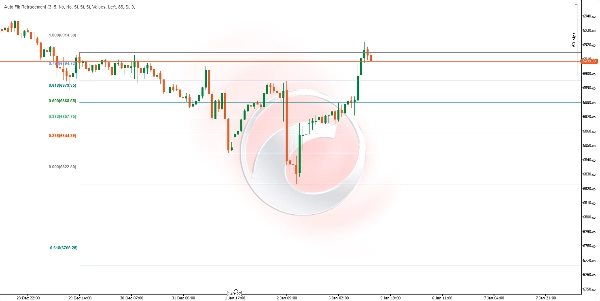
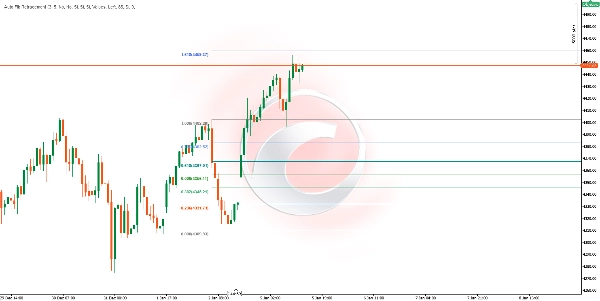
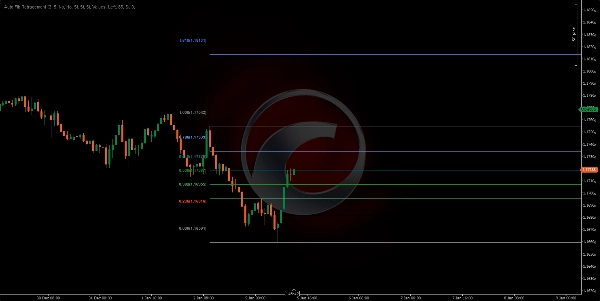
Auto Fib Retracement là một chỉ báo phân tích kỹ thuật tự động vẽ các mức thoái lui và mở rộng Fibonacci dựa trên các biến động giá quan trọng gần đây nhất. Khác với các công cụ Fibonacci thủ công, chỉ báo này tự động phát hiện các điểm xoay của thị trường và cập nhật các mức trong thời gian thực.
⚙️ Nó hoạt động như thế nào?
Phát hiện điểm xoay tự động
Chỉ báo sử dụng thuật toán ZigZag động để xác định các đỉnh và đáy giá quan trọng:
- Lookback (Độ sâu): Xác định số thanh được phân tích ngược lại để xác nhận một điểm xoay. Giá trị cao hơn phát hiện các dao động lớn hơn; giá trị thấp hơn nhạy cảm hơn với các biến động nhỏ hơn.
- Độ nhạy (Độ lệch): Kiểm soát mức độ quan trọng của biến động giá để hình thành điểm xoay mới. Nó được tính bằng cách nhân ATR 10 kỳ (Average True Range) với hệ số này. Giá trị cao hơn lọc bỏ nhiễu và chỉ phát hiện các biến động quan trọng.
Tính toán các mức Fibonacci
Khi hai điểm xoay gần nhất (một đỉnh và một đáy) được xác định, chỉ báo tính toán từng mức bằng công thức Fibonacci cổ điển:
Mức = Giá neo + (Phạm vi di chuyển × Tỷ lệ Fibonacci)
Trong đó:
- Giá neo: Giá của điểm xoay gần nhất (hoặc điểm trước nếu hướng đảo ngược)
- Phạm vi di chuyển: Sự khác biệt giữa hai điểm xoay
- Các tỷ lệ có sẵn: 0, 0.236, 0.382, 0.5, 0.618, 0.65, 0.786, 1, 1.272, 1.414, 1.618, 1.65, 2.618, 2.65, 3.618, 3.65, 4.236, 4.618, và các mức âm (-0.236, -0.382, -0.618, -0.65)
📈 Nó dùng để làm gì?
UseDescription
Xác định Hỗ trợ & Kháng cự
Các mức 0.382, 0.5, và 0.618 là các vùng cổ điển nơi giá thường phản ứng 🔵
Xác định Mục tiêu Giá
Các mức mở rộng (1.618, 2.618, 3.618, 4.236) giúp dự đoán mức di chuyển có thể đạt được 🎯
Lên kế hoạch vào lệnh
Tìm các đợt hồi về các mức chính để vào lệnh theo xu hướng ⬆️⬇️
Đặt điểm dừng lỗ
Đặt điểm dừng vượt qua các mức Fibonacci liên quan 🛑
Xác nhận các vùng đảo chiều
Khi giá đạt đến các mức mở rộng cực đoan, có thể báo hiệu sự kiệt sức 🔄
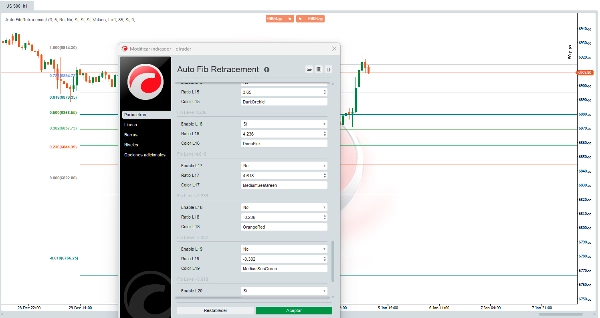
🛠️ Cách sử dụng
Các tham số chính
Tham sốMô tảGiá trị đề xuất
Độ nhạy
Hệ số nhân độ lệch để lọc các biến động nhỏ
3 (mặc định)
Lookback
Số thanh tối thiểu để tính các điểm xoay
10 (mặc định)
Đảo chiều hướng
Đảo điểm tham chiếu để tính toán mức
Tắt
Tùy chọn hiển thị
Tùy chọnChức năng
Mở rộng trái / phải
Mở rộng các đường ngang sang bên trái hoặc bên phải của biểu đồ
Hiển thị giá
Hiển thị giá chính xác của từng mức
Hiển thị tỷ lệ
Hiển thị tỷ lệ Fibonacci (giá trị hoặc phần trăm)
Vị trí nhãn
Đặt vị trí nhãn sang trái hoặc phải
Độ mờ vùng
Kiểm soát độ trong suốt của các vùng màu giữa các mức
Các mức Fibonacci có thể cấu hình
Mỗi trong số 22 mức có thể:
- Kích hoạt hoặc vô hiệu hóa riêng lẻ
- Thay đổi giá trị số của nó
- Thay đổi màu sắc của nó
💡 Diễn giải các vùng
Các vùng màu giữa các mức liên tiếp giúp nhận diện trực quan:
- Vùng xanh lá/xanh dương (0.382 - 0.786): Khu vực hồi giá lành mạnh trong xu hướng. Vùng phổ biến để tìm điểm vào lệnh. ✅
- Vùng mức 1.0: Biểu thị 100% của đợt di chuyển trước đó. Là hỗ trợ/kháng cự chính. ⚖️
- Vùng đỏ/hồng (1.618+): Mở rộng của đợt di chuyển. Giá đạt đến các vùng này có thể báo hiệu sự mở rộng quá mức. ⚠️
⚠️Lưu ý
- Chỉ báo cập nhật tự động khi phát hiện các điểm xoay quan trọng mới
- Nó hoạt động trên bất kỳ khung thời gian và tài sản tài chính nào
- Các mức Fibonacci là vùng xác suất, không phải là đảm bảo
- Khuyến nghị sử dụng kết hợp với các chỉ báo khác hoặc phân tích hành động giá
- Trong các thị trường đi ngang hoặc biến động mạnh, các điểm xoay có thể thay đổi thường xuyên
📝 Ghi chú kỹ thuật
- ATR 10 kỳ được sử dụng nội bộ để tính ngưỡng động cho việc phát hiện điểm xoay
- Chỉ báo yêu cầu dữ liệu lịch sử tối thiểu tương đương gấp đôi tham số Lookback để hoạt động chính xác
- Các đường và vùng chỉ được vẽ lại chỉ trên thanh cuối cùng để tối ưu hiệu suất 🚀
Tóm tắt
The indicator helps traders identify potential support and resistance zones, define price targets, plan entries on pullbacks, set stop-losses beyond key levels, and confirm reversal zones when price reaches extreme extensions. It works on any timeframe and financial asset, including Forex, stocks, commodities, indices, and cryptocurrencies such as BTCUSD, EURUSD, GBPUSD, XAUUSD, NAS100, and others.
Users can customize parameters like sensitivity, lookback period, direction inversion, and display options (line extension, price and ratio labels, zone opacity, and colors). Colored zones visually highlight key Fibonacci areas for easier interpretation. The indicator updates automatically with new pivots and redraws levels on the latest bar to optimize performance.


![Logo "[Stellar Strategies] MARSI Signal Plotter"](https://cdn.ctrader.com/image/webp/7b2b8da6-8f8e-4646-8d4a-4710c516c01e_25567)

