present
Kaydolun ve ilk alışverişinizde $50 indirim kazanın
Trading product for CCZ - Candle Concentration Zone Gösterge Key Levels Supply & Demand, image 1
CCZ - Candle Concentration Zone
Gösterge
2 i̇ndirmeler
Sürüm 1.0, Sep 2026
Windows, Mac
Trading product for CCZ - Candle Concentration Zone Gösterge Key Levels Supply & Demand, image 2
Trading product for CCZ - Candle Concentration Zone Gösterge Key Levels Supply & Demand, image 3
Trading product for CCZ - Candle Concentration Zone Gösterge Key Levels Supply & Demand, image 4
Başlangıç 08/08/2026
2
Ücretsiz yüklemeler

Açıklama

The Main Concept:

Classic support and resistance measures “reaction”: how many times did price turn here? CCZ measures “acceptance”: how long did price agree to trade here?

CCZ do an honest measure: “How many candles in an unbroken row accepted this price?”


The method:
1. Take a slice of recent price and cut it into thin horizontal bands, each about a fraction of the current ATR tall. Think of them as shelves.
2. For each band, walk through the candles and count the longest unbroken run whose high-to-low range crosses that band. One candle that misses ends the streak, and the count starts again from zero.
3. Any band whose best run clears a threshold — say six candles (or set by user’s own rules) — becomes a zone.

The "in a row" rule is the whole idea. A wall of consecutive overlapping candles is consolidation — a fair-value shelf.
 ─────────────────────────────────────
             │ │ │ │ │ │       │ │
             ▓ ▓ ▓ ▓ ▓ ▓   ✗   ▓ ▓
             1 2 3 4 5 6  miss  1 2
             └── 6 in a row ──┘  ↑   └ run resets
                  qualifies    gap
─────────────────────────────────────


Reading the zones

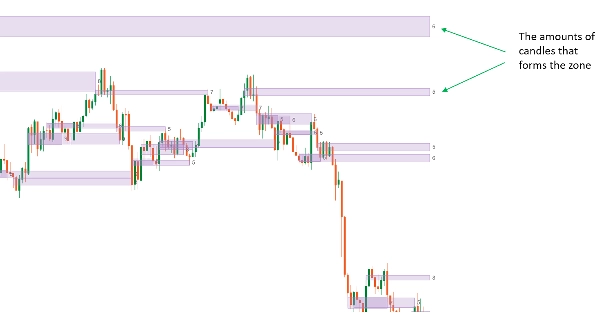
Each zone is a rectangle spanning a price band, with a number printed on it. That number is the length of the longest unbroken run of candles that all touched the band — the zone's strength score. A "6" means six candles in a row shared that price; a "12" is a much more contested level than a "6".

A zone's right edge extends forward as long as it stays relevant. Once price has moved away and then comes back, the zone is **mitigated** — it has been tested and stops extending. You choose what "comes back" means:

- “Touch” — any wick back into the zone mitigates it (strict)
- “Close inside” — only a candle closing inside counts (lenient)
- “Touch then close inside” — a wick first, then a later candle closing inside — ignores single-wick rejections

An option to hide zones once mitigated keeps the chart down to only the levels still in play.

Zone detection on any base timeframe

The candles being counted don't have to be the candles on your chart. Set a base timeframe once — lower, equal, or higher than your chart — and the zones are built from that timeframe's candles no matter which chart you're viewing them on.

Run it on H1 candles while trading from an M5 chart, and the same H1-built zones sit on both charts. Zoom into M1 and they're still the same levels — you're looking at a magnified view of one detection, not a different one per timeframe.

Settings

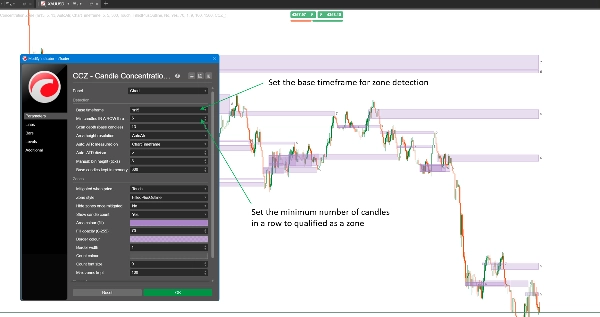
- Base timeframe — independent of the chart, any resolution
- Min candles in a row required to qualify a zone
- Scan depth — how many base candles the rolling window covers
- Area height resolution: Auto (ATR-based) or Manual (fixed ticks)
- Auto mode: measure ATR on the chart timeframe or the base timeframe, plus an ATR divisor to set how tight a band counts as "the same level"
- Base candles kept in memory
- Mitigation rule: Touch / Close inside / Touch then close inside
- Zone style: outline only, or filled + outline, with independent fill opacity
- Hide zones once mitigated
- Candle-count label: on/off, colour, font size
- Border colour and width, max zones kept, chart bars scanned on load


Typical use

Use it as an objective second opinion on your own support and resistance — a level only appears because candles repeatedly proved it mattered, not because it looks important on the chart.

Run the base timeframe higher than your entry chart to trade from clean higher-timeframe shelves without switching windows to find them. Or match it to your chart timeframe for a pure price-action read of where the current session keeps getting rejected.

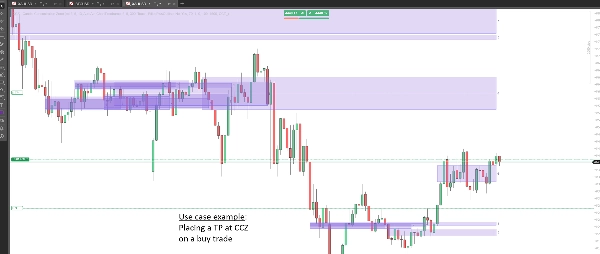
It pairs naturally with a separate entry trigger: use the zones as your bias for where to look for a reversal or a breakout, and your own signal for when to act on it. At some occasion, you can also read it as a target area.

 
Who it's for

Traders who already think in terms of support, resistance, or supply and demand zones, and want a rule-based way to find the strong ones instead of eyeballing swing highs. Useful from scalping timeframes up to swing trading, on forex, indices, metals, or crypto. It assumes you already have a way to decide entries — this tool finds the levels, not the trigger.

What it does not do

- It gives no buy or sell signals, and no entry, stop or target prices
- It places no orders and cannot touch your account — the indicator runs with no access rights at all
- It has no alerts or notifications
- It does not repaint history: only closed candles are counted, and a zone's strength number never changes after the fact. Its right edge does keep extending forward each bar until the zone is mitigated — that's the zone staying live, not the past being redrawn

Things worth knowing

If you set the base timeframe higher than your chart's, switch "ATR measured on" to the base timeframe too. Leaving it on the chart timeframe measures a higher-timeframe candle with a smaller ruler, which makes the price band far too thin and zones far too rare to form.
A zone can only be judged mitigated after price has first left it and then returned — a zone still forming can't be mitigated on its own first candle.
Higher-timeframe base candles start at your broker's server time. Two brokers can legitimately cut the same higher-timeframe candle at different points, so zones on the same symbol can read slightly differently across brokers. That's a property of the data, not a fault in the indicator.


Trading involves risk. Past performance does not guarantee future results.

Özet

YZ özeti
CCZ - Candle Concentration Zone is a support and resistance indicator that identifies price zones based on consecutive candle overlap within the same price range. Unlike traditional methods that count price reaction points, CCZ measures how long price consolidates at specific levels by detecting the longest unbroken sequence of candles crossing horizontal price bands. These bands are defined as thin horizontal slices approximately a fraction of the Average True Range (ATR) tall.

Key features include:
- Detection of zones from any user-defined base timeframe, independent of the chart timeframe, allowing higher timeframe zones to be viewed on lower timeframe charts.
- Zones are displayed as rectangles with a strength score indicating the longest consecutive candle count overlapping the zone.
- Mitigation rules determine when a zone is considered tested and no longer extends forward, with options for strict or lenient definitions based on candle touches or closes.
- Customizable settings such as minimum candles in a row, scan depth, band height resolution, zone style, and label display.
- Designed for traders who use support, resistance, or supply and demand concepts and want an objective, rule-based method to identify strong levels.
- Supports markets including forex, indices, metals, and crypto across scalping to swing trading timeframes.
- The indicator does not provide trade signals, alerts, or order execution capabilities and does not repaint historical data.

CCZ serves as a tool to objectively highlight price consolidation zones that can be used as bias areas for potential reversals or breakouts.
Gösterge profili
Gösterge kategorisi
Destek ve direnç
Çıktı türü
Görselleştirme
Veri gereklilikleri
Yalnızca çubuklar
Desteklenen sinyaller
Kırılma
Seviyeye dokunuş
Seviye kırılması

Müşteri değerlendirmeleri

0.0
Değerlendirmeler: 0
Müşteri değerlendirmeleri
Bu ürün için henüz bir değerlendirme yok. Ürünü denediniz mi? O zaman ona dair görüşlerini paylaşan ilk kişi olun!

Tartışma

SSS

Key Levels
Supply & Demand
Mitigation Block
ATR
Support & Resistance
cTrader Store üzerinden erişilebilen işlem botları, göstergeler ve eklentiler gibi ürünler, üçüncü taraf sağlayıcılar tarafından sağlanır ve yalnızca bilgilendirme ve teknik erişim amaçlarıyla sunulur. cTrader Store bir broker değildir ve yatırım tavsiyesi, kişisel öneriler vermez veya gelecekteki performansı garanti etmez.

Bu oluşturanın diğer ürünleri

Gösterge
Doji
Engulfing
+3
Multi Timeframe OHLC levels (daily, weekly, and monthly), with a two-day price action bias dashboard
Gösterge
Engulfing
Fibonacci
+4
Six higher-timeframe candle sets on one chart, with liquidity sweep detection and swept levels.

Şunları da beğenebilirsiniz

Gösterge
Key Levels
Order Block
+5
Pixel-perfect trading zones in a click! Instantly draw, resize & color via hotkeys. Automate your charting routine
Gösterge
ADX
MACD
+3
Displays Boshi Chanlun Structure Indicator chart structures for supported Pepperstone cTrader symbols and timeframes.
Gösterge
BOS
CHOCH
+5
BOS/CHoCH signals confirmed by liquidity sweep + FVG confluence, with a live conviction score.
Gösterge
Parabolic SAR Alert - Trend reversal alerts with smart signals & custom alerts.
Gösterge
Forex
EURUSD
+4
A precision overlay tool that combines session-aware VWAP logic and standard deviations.
Gösterge
Grid
Forex
+5
Square Matrix Trading System by LudwigICT – Institutional-Grade Trading Clarity in cTrader
Gösterge
SMC
Prop
+14
BoS ChoCH Pro,Strict Mode,False Breakout Filter,Average hit rate: 72-78%
Gösterge
Prop
Forex
+5
Pivot Point with base zone daily Asia-London-New york Session.
Gösterge
ATR
RSI
+24
Daily moving averages, simplified. Displays 3 daily moving averages on lower timeframes with selectable MA types.
Gösterge
EMA
RSI
+5
Keep your focus with smart on-chart notes. Features Markdown, 6 themes, and auto-save per symbol for manual trading.When
Gösterge
Prop
Forex
+4
Universal multi time frame 'Moving Average' indicator with extended features
Gösterge
Prop
Forex
+5
Transform your approach to trading with our innovative Pivot Point Indicator.
Gösterge
ATR
Prop
+15
🚀 Adaptive trailing stop that uses logarithmic normalized volatility....
Gösterge
AI
Prop
+9
Phoenix Zones - Detector de Reversiones Críticas
Gösterge
Prop
Forex
+12
First Presented Fair Value Gap (FPFVG)
Gösterge
AI-assisted
Order Block
+5
The daily bias estimator indicator uses ICT concepts to show whether the chart is bullish or bearish on multi-time frame
Gösterge
Breakout
Open Range Breakout by SLA is a fully customizable multi-session indicator designed for structured intraday traders.
Gösterge
Fisher Transform with smoothing. Spot reversals and cycles with precision. Great for any market, any timeframe.

Fiyat

Başlangıç 08/08/2026
2
Ücretsiz yüklemeler