present
Registe-se e receba 50 $ de desconto na sua primeira compra
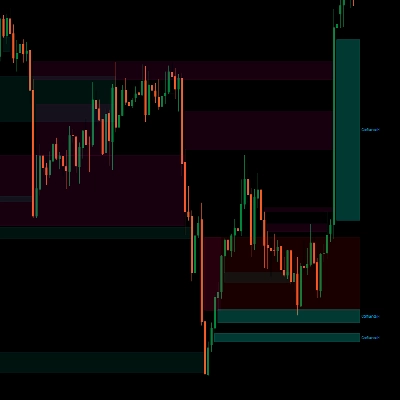
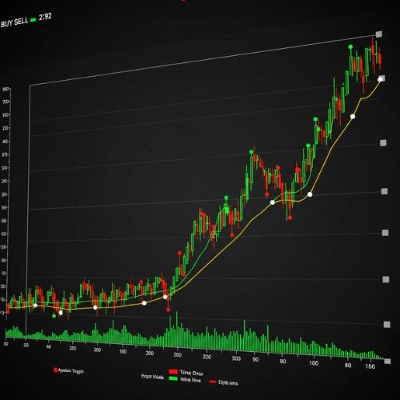
Trading product for StrongSupertrend Indicador Keltner Channels Key Levels, image 1
StrongSupertrend
Indicador
Versão 1.0, Oct 2026
Windows, Mac
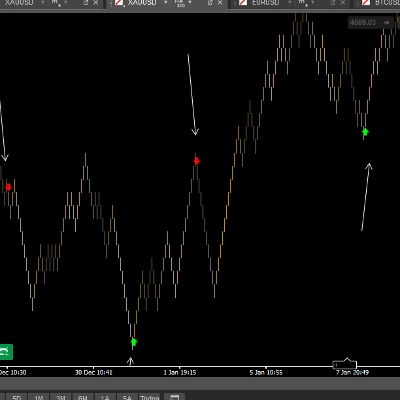
Trading product for StrongSupertrend Indicador Keltner Channels Key Levels, image 2
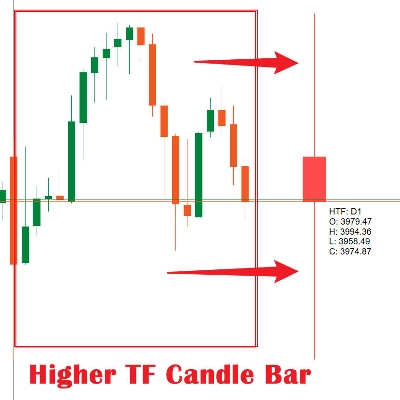
Trading product for StrongSupertrend Indicador Keltner Channels Key Levels, image 3
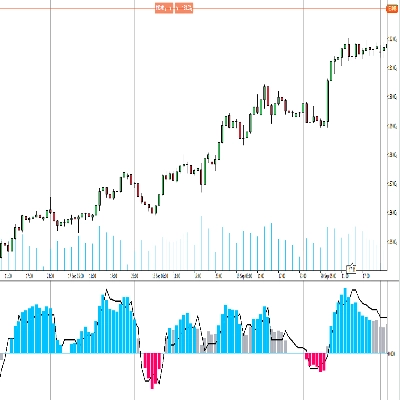
Trading product for StrongSupertrend Indicador Keltner Channels Key Levels, image 4
Desde 23/06/2025
1
Vendas

Descrição

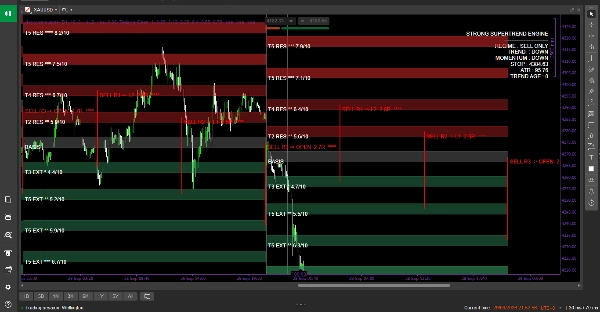
Strong Supertrend Turn Market Movement into a Clear Map

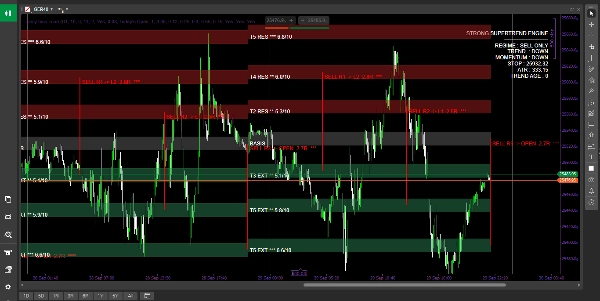
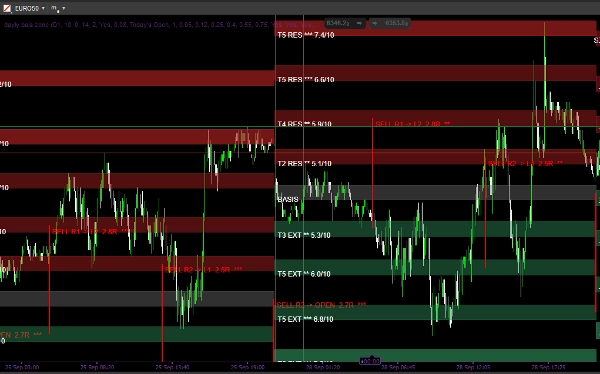
Market analysis is no longer just about searching for a buy or sell signal. The Strong Supertrend Engine is designed to give you a broader view of the market by transforming trend, volatility, momentum, and price zones into an easy-to-read dynamic map. The indicator relies on the Supertrend, ATR, and Basis to build a clear market structure, then identifies multiple levels around the price and evaluates the strength of each zone with a score from 0 to 10 to help you identify the areas worth watching. Through Laguerre Momentum analysis and a custom Dashboard interface, you can see the trend, momentum status, and market level at a glance, alongside potential continuation scenarios and risk-to-reward ratios. The indicator is not merely a tool that gives you an arrow on a chart; rather, it is a comprehensive analysis system that translates complex price action into an organized map, helping you understand where the market is moving, what the key zones are, and when you need further confirmation before making a decision.

How to Use: Start by reading the Dashboard to determine the overall market condition, trend, and momentum. Then, use the Basis as a reference point to understand the price position, while monitoring the five zone layers above and below it, paying closer attention to higher-rated zones. Use the Supertrend zone as an additional reference for the trend and for support or resistance, and watch how the price interacts with the specified zones instead of entering blindly the moment price reaches them. Afterward, a smaller timeframe can be used to confirm price action and determine the entry point, stop loss, and target. Meanwhile, the Continuation scenarios displayed by the indicator serve as potential visualizations of continuing movement rather than automated trading orders. In this way, the indicator functions as a decision-making map: it defines the context and critical zones first, leaving the trader responsible for entry confirmation and risk management.

Resumo

AI summary
StrongSupertrend is a comprehensive trading indicator that transforms market movement into a clear, dynamic map by integrating trend, volatility, momentum, and price zones. It combines Supertrend, Average True Range (ATR), and Basis calculations to construct a structured market overview, highlighting multiple price levels with strength scores ranging from 0 to 10. The indicator incorporates Laguerre Momentum analysis and presents data through a custom Dashboard interface, enabling users to quickly assess trend direction, momentum status, key market zones, and potential continuation scenarios alongside risk-to-reward ratios.

Users start by interpreting the Dashboard to gauge overall market conditions, then use the Basis as a price reference point while monitoring five zone layers above and below it, focusing on higher-rated zones. The Supertrend zone serves as an additional trend and support/resistance reference. Price interactions with these zones guide decision-making rather than triggering automatic entries. Traders can confirm entries, stop losses, and targets using smaller timeframes. Continuation scenarios provide visual forecasts of possible market moves without automated orders. This indicator functions as a decision-making tool that organizes complex price action into an accessible format, supporting informed trading decisions. It supports visualization outputs and signals including trend strength, volatility regime, level breaks, and level touches, relying on bar and volume data inputs.
Perfil do indicador
Categoria do indicador
Tendência
Tipo de resultado
Visualização
Requisitos de dados
Apenas barras
Volume
Sinais suportados
Força da tendência
Volatilidade
Quebra de nível
Toque no nível

Avaliações de clientes

0.0
Avaliações: 0
Avaliações de clientes
Ainda não há avaliações para este produto. Já o experimentou? Seja o primeiro a contar a outras pessoas!

Conversa

Perguntas frequentes

Keltner Channels
Key Levels
ATR
Wedge
Os produtos disponíveis através da cTrader Store, incluindo bots de negociação, indicadores e plugins, são fornecidos por programadores terceiros e são disponibilizados apenas para fins informativos e de acesso técnico. A cTrader Store não é um corretor e não fornece aconselhamento em matéria de investimento, recomendações pessoais ou qualquer garantia de desempenho no futuro.

Mais deste autor

Indicador
VWAP
Volume
+4
Advanced Order Flow & Volume Profiling for cTrader. Unveil institutional footprints, Delta, and Anchored VWAPs.

Também poderá gostar de

Indicador
RSI
RSI on the main chart with 45/55 momentum levels, overbought/oversold levels, averaged RSI, and multi-timeframe support.
Indicador
Forex
Indices
+1
Professional Fair Value Gaps with multitimeframe spot on
Indicador
Signal
Trades Opening Range Breakouts Indicator with dynamic stops/targets adapting to market volatility.
Indicador
RSI
MACD
+7
The ZigZag indicator is a technical analysis tool primarily used to identify key price reversal points.
Indicador
VWAP
Volume
+2
VWAP Bands and Swing Wick Structure Indicator
Indicador
It draws a step line that visualize the movement of H4. Particularly effective when trade on lower timeframe.
Indicador
Signal
Scalping
Average accuracy of around 60% to 70% on 45min timeframes it is highly recommended to use stop losses
Indicador
AI
Prop
+14
Professional Trading Indicator Transform Your Trading with Intelligent Signal Detection RenkoProfit
Indicador
MACD
Signal
Enhance your trading strategy with our customizable TradingViewMACD indicator. Optimize and elevate your market analysis
Indicador
Prop
Forex
+5
Higher TimeFrame Candle Tracker: Current Timeframe (Any TimeFrame) Show High TimeFrame Candle Bar
Indicador
Forex
BTCUSD
+11
Unlock trading precision with QQE! Dual QQE indicators with a Bollinger Bands zero line provide clear buy/sell signals.
Indicador
AI
ATR
+27
VolumeProfileSuite is an advanced and flexible Volume Profile indicator for cTrader.
Indicador
AI
ATR
+26
SMC without the mess: Clean structure + auto-managing FVGs + MTF panel. Hard-right-edge, step size-based for any symbol.
Indicador
The Multi-Timeframe Candle Indicator displays candles from multiple timeframes in one window, enhancing market analysis!
Indicador
Signal
Supertrend
Multi-symbol multi-timeframe SuperTrend panel with watchlist, one-click jump, and alerts.
Indicador
ATR
RSI
+1
Super Trend Rsi ,ATR + trend change distance + dynamic Alpha, divergence/convergence
Indicador
AI
ATR
+26
MacD Custom Indicator-Multiple Time Frame
Indicador
ADX
ATR
+5
Configure, simulate, and analyze trading strategies with custom filters, multi-target exits, and detailed performance me

Preço

Desde 23/06/2025
1
Vendas