
Penerangan
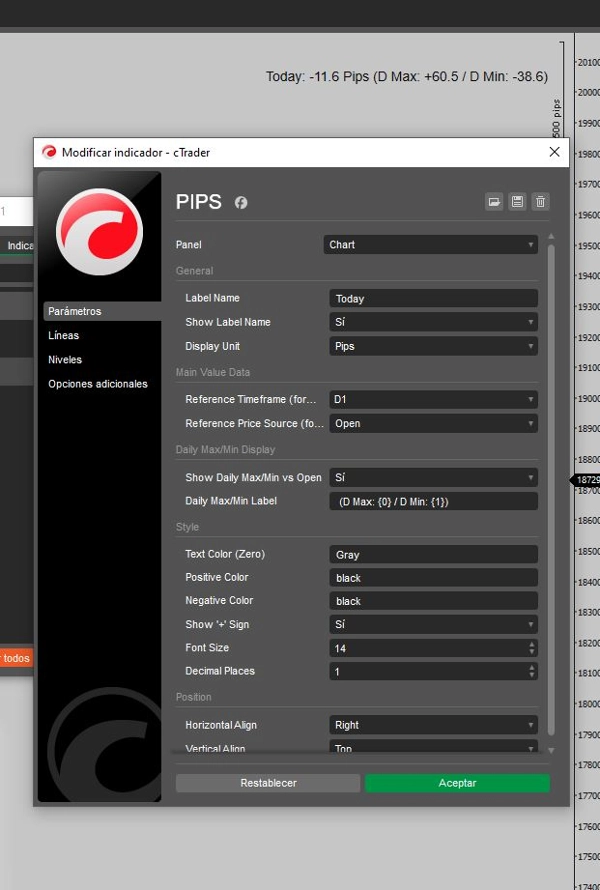
Skrip ini direka untuk pedagang yang mencari analisis masa nyata tindakan harga berkaitan dengan tahap harian utama. Ia mengira dan memaparkan jarak pip antara harga semasa dan tinggi harian, rendah, dan buka pada carta anda.
Ciri-ciri Utama:
- Data Masa Nyata: Menyediakan jarak pip masa nyata dari harga semasa ke tinggi harian, rendah, dan buka.
- Kejelasan Visual: Menawarkan paparan yang bersih dan minimalis, menghapuskan kekacauan carta yang tidak perlu.
- Serbaguna: Sesuai untuk scalper, pedagang harian, dan pedagang ayunan, meningkatkan pembuatan keputusan pada tahap harga kritikal.
- Prestasi Efisien: Ringan dan dioptimumkan untuk pelaksanaan pantas, memastikan integrasi lancar ke dalam aliran kerja perdagangan anda.
Manfaat:
- Keputusan Berinformasi: Menilai dengan cepat kedudukan pasaran berbanding tahap harian utama.
- Penjimatan Masa: Akses segera kepada data harga penting tanpa perlu menavigasi melalui pelbagai alat.
- Boleh Disesuaikan: Sesuai untuk pedagang yang mencari cara peribadi dan tidak mengganggu untuk menjejak tahap harga.
Ringkasan
Ringkasan AI
Pips V4Final is a trading indicator that provides real-time analysis of price action relative to key daily levels. It calculates and displays the pip distance between the current price and the daily high, low, and open directly on the chart. The indicator features a clean, minimalist interface designed to reduce chart clutter, making it suitable for scalpers, day traders, and swing traders. It is lightweight and optimized for fast execution, allowing seamless integration into various trading workflows. Users can quickly assess market positioning at critical price points, saving time by accessing essential price data instantly. The tool is customizable, offering a non-intrusive way to monitor important daily price levels for informed decision-making.
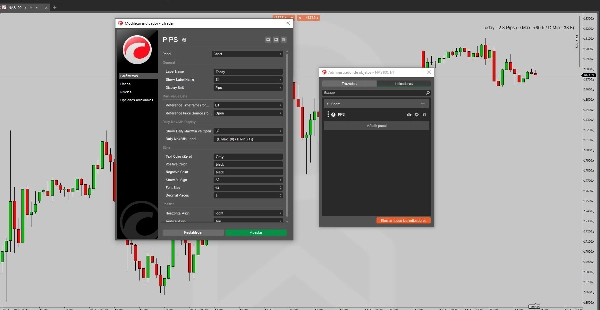
Profil indikator
Ulasan pelanggan
4.5
Ulasan: 2
5 | 50 % | |
4 | 50 % | |
3 | 0 % | |
2 | 0 % | |
1 | 0 % |
Perbincangan
Soalan Lazim
Produk yang tersedia melalui cTrader Store, termasuk bot dagangan, indikator dan plugin, disediakan oleh pembangun pihak ketiga dan diberikan akses untuk tujuan maklumat dan teknikal sahaja. cTrader Store bukan broker dan tidak memberikan nasihat pelaburan, syor peribadi atau sebarang jaminan prestasi masa hadapan.
Lebih banyak produk daripada penulis ini


Harga
Sejak 13/01/2025
2
Jualan