
Squeeze Momentum Indicator 2.0version
Indicador
54 transferências
Versão 1.0, Nov 2025
Windows, Mac
Descrição
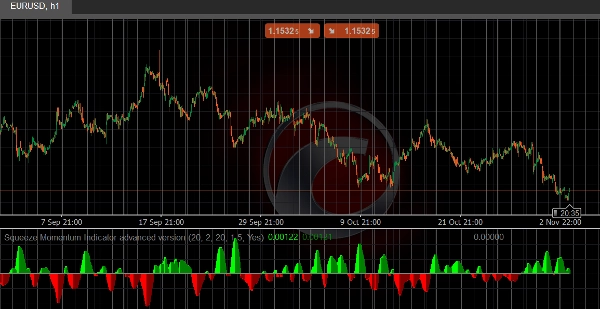
Este indicador cTrader implementa a popular estratégia Squeeze Momentum, projetada para identificar períodos de consolidação de baixa volatilidade e potenciais oportunidades de rompimento.
Como Funciona:
- Compara as Bandas de Bollinger com os Canais de Keltner para detectar condições de "aperto" de volatilidade
- Mede a força do momentum usando cálculos de regressão linear
- Fornece sinais visuais claros através de histogramas codificados por cores e linhas zero dinâmicas
Principais Características:
🎯 Detecção de Aperto - Identifica quando as Bandas de Bollinger se movem dentro dos Canais de Keltner (aperto) e quando se expandem (rompimento)
📊 Medição de Momentum - O histograma exibe a força e a direção do momentum atual
🎨 Sinais Visuais:
- Barras Verde-Limão/Verde: Momentum de alta (fortalecendo/enfraquecendo)
- Barras Vermelhas/Marrom: Momentum de baixa (fortalecendo/enfraquecendo)
- Linha zero Azul/Preta/Cinza: Sem aperto/Aperto ativo/Aperto liberando
Parâmetros Personalizáveis:
- Comprimento e Multiplicador BB
- Comprimento e Multiplicador KC
- Opção TrueRange para cálculo do Canal de Keltner
Perfeito Para:
- Identificar rompimentos de consolidação
- Temporizar entradas durante períodos de baixa volatilidade
- Confirmar a direção do momentum
- Swing trading e position trading
Resumo
Perfil do indicador
Avaliações de clientes
0.0
Avaliações: 0
Avaliações de clientes
Ainda não há avaliações para este produto. Já o experimentou? Seja o primeiro a contar a outras pessoas!
Conversa
Perguntas frequentes
Prop
Forex
Breakout
Indices
Commodities
Crypto
Stocks
Bollinger
Os produtos disponíveis através da cTrader Store, incluindo bots de negociação, indicadores e plugins, são fornecidos por programadores terceiros e são disponibilizados apenas para fins informativos e de acesso técnico. A cTrader Store não é um corretor e não fornece aconselhamento em matéria de investimento, recomendações pessoais ou qualquer garantia de desempenho no futuro.


![Logótipo de "[Hamster-Coder] Pivot Points MTF"](https://cdn.ctrader.com/image/webp/4c143e5a-309c-40e3-a578-f04d1e133ffa_31159)


Preço
10M
Volume negociado
10.64K
Pips ganhos
23
Vendas
1.23K
Instalações gratuitas