

Описание
Индикаторы Pinescriptlabs Store: cBots из Pinescriptlabs Store : (cBot) Gold & BTC BreakoutSession Pivots(новинка)
PRICE ACTION (Новинка)
Trailing Smart Algorithm (Новинка)
Карта ликвидаций с кредитным плечом
Прогноз на основе Linreg & ATR
SmartTrend Поддержка и
Сопротивление
Линии
Сессии разрыва справедливой стоимости
Динамический
Анализ структуры рынка
Поворотных
Точек
Points
Фибоначчи
Линейная
Регрессия
Мульти-таймфрейм
Импульсный разрыв справедливой стоимости
Многоуровневый
Трекер свечного смещения
Tracker
Авто
Линии поддержки и
сопротивления
Тренда
Lines
Все
Уровни поддержки и
сопротивления
Levels
Динамический импульс диапазона
Описание:
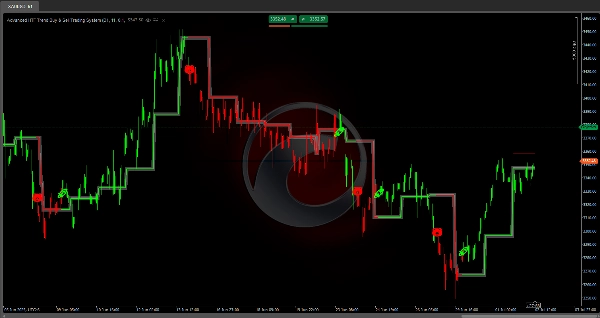
Продвинутая торговая система покупки и продажи на HTF тренде
Что это и для чего?
Это алгоритм технического анализа, который автоматически определяет уровни поддержки и сопротивления 📈 на основе исторических ценовых диапазонов и обнаруживает, когда цена пробивает эти уровни для генерации сигналов тренда 💡.
Как работает логика?
1️⃣ Расчет диапазона
Индикатор анализирует заданный исторический период (полностью настраиваемый) для поиска:
• максимальной цены, достигнутой за этот период 📊
• минимальной цены, достигнутой за этот период 📉
• средней точки между этими уровнями ⚖️
2️⃣ Установление уровней
После определения экстремумов индикатор:
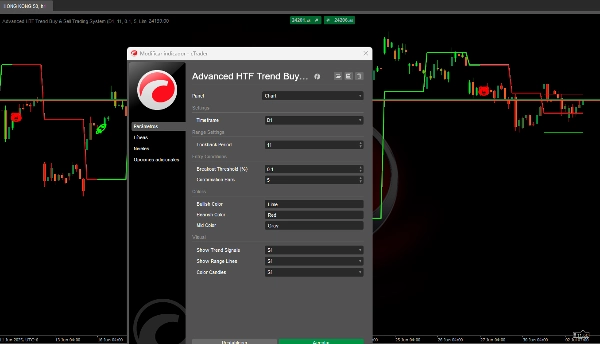
• Рисует красную линию на максимальном уровне (сопротивление)
• Рисует зеленую линию на минимальном уровне (поддержка)
• Добавляет буфер безопасности к каждому уровню для предотвращения ложных сигналов 🛡️
3️⃣ Обнаружение прорыва
Система постоянно отслеживает цену для обнаружения:
• Бычьего прорыва 🚀: когда цена закрывается выше уровня сопротивления + буфера
• Медвежьего прорыва 🐻: когда цена закрывается ниже уровня поддержки - буфера
4️⃣ Система подтверждения
Перед генерацией окончательного сигнала ✅ индикатор:
• Ожидает заданное количество последовательных баров, подтверждающих прорыв ⏳
• Только после подтверждения официально меняет тренд
5️⃣ Динамическое обновление
Уровни пересчитываются автоматически:
• При начале нового периода (дневного, недельного или месячного, в зависимости от настроек) 🔄
• Линии продолжаются до установки новых уровней
• Линия середины меняет цвет в зависимости от текущего тренда
Как использовать ?
✨ Сигналы:
• Покупка: Символ 🚀 появляется при подтверждении бычьего прорыва
• Продажа: Символ 🐻 появляется при подтверждении медвежьего прорыва
🎨 Окраска свечей:
• Свечи автоматически окрашиваются в соответствии с текущим трендом:
✅ Зеленый: Активный бычий тренд
❌ Красный: Активный медвежий тренд
Настройки параметров
🔧 Период обратного отсчета (5–200, по умолчанию: 11)
Что он контролирует?
Количество исторических баров, используемых для расчета максимумов и минимумов.
Влияние при изменении:
• Низкие значения (5–15):
- Более реактивные и частые уровни
- Большее количество сигналов
- Лучше для скальпинга и краткосрочных сделок
- Идеально для высоковолатильных рынков
• Высокие значения (30–50):
- Более стабильные и долговечные уровни 🏛️
- Меньше, но более надежные сигналы
- Лучше для свинг-трейдинга и среднесрочных позиций
- Идеально для более стабильных рынков
📏 Порог прорыва (0.01–5.0%, по умолчанию: 0.1%)
Что он контролирует?
Дополнительный буфер, который цена должна превысить для подтверждения прорыва.
Влияние при изменении:
• Низкие значения (0.05–0.15%):
- Ранние и более чувствительные сигналы 🔍
- Более высокий риск ложных прорывов
- Идеально для основных валют Forex с низкими спредами
- Лучше для рынков с высокой ликвидностью
• Высокие значения (0.3–1.0%):
- Поздние, но более надежные сигналы 🛡️
- Меньший риск рыночного шума
- Идеально для криптовалют и волатильных активов
- Лучше для рынков с более широкими спредами
⏳ Подтверждающие бары (1–5, по умолчанию: 1)
Что он контролирует?
Сколько последовательных баров должно подтвердить прорыв перед генерацией сигнала.
Влияние при изменении:
• 1 бар:
- Мгновенные сигналы ⚡
- Больше торговых возможностей
- Более высокий риск преждевременных сигналов
- Идеально для активных трейдеров
• 2–3 бара:
- Баланс между скоростью и надежностью ⚖️
- Значительно снижает количество ложных сигналов
- Идеально для большинства стратегий
• 4–5 баров:
- Очень консервативные сигналы 🕊️
- Максимальная надежность
- Может пропускать ранние возможности
- Идеально для долгосрочных позиций
📊 Оптимизация по типу актива
💱 Основные валюты Forex (EUR/USD, GBP/USD и др.)
• Период обратного отсчета: 15–25
• Порог: 0.05–0.15%
• Подтверждение: 1–2 бара
💰 Криптовалюты
• Период обратного отсчета: 10–20
• Порог: 0.2–0.8%
• Подтверждение: 2–3 бара
📈 Фондовые индексы
• Период обратного отсчета: 20–30
• Порог: 0.1–0.3%
• Подтверждение: 1–2 бара
🌾 Товары
• Период обратного отсчета: 25–35
• Порог: 0.15–0.4%
• Подтверждение: 2–3 бара
Особенности
• Может генерировать поздние сигналы на очень быстро движущихся рынках 🏃♂️
• Менее эффективен на крайне боковых рынках
• Требует настройки параметров в зависимости от актива и таймфрейма ⏱️
Сводка
The system continuously monitors price action to detect bullish breakouts (price closing above resistance plus buffer) and bearish breakouts (price closing below support minus buffer). It includes a confirmation mechanism that waits for a configurable number of consecutive bars confirming the breakout before officially signaling a trend change. The midpoint line changes color to reflect the current trend, and all levels update dynamically at the start of new periods (daily, weekly, or monthly).
Signals are visually indicated with symbols: a rocket (🚀) for confirmed bullish breakouts and a bear (🐻) for confirmed bearish breakouts. Candles are colored green for active bullish trends and red for bearish trends.
Key adjustable parameters include lookback period (5–200 bars), breakout threshold buffer (0.01–5.0%), and confirmation bars (1–5). These settings can be optimized for various asset types such as Forex majors, cryptocurrencies, stock indices, and commodities, balancing signal frequency, reliability, and market conditions. The indicator supports multiple timeframes and is suitable for scalping, swing trading, and longer-term strategies depending on configuration.


![Логотип продукта "Smart Money Concepts (SMC) [Iridio Capital]"](https://cdn.ctrader.com/image/webp/28b69fd1-ef54-4bed-9487-07e78e883be4_40934)


