

Описание
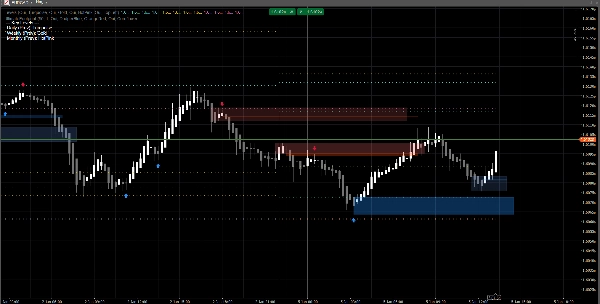
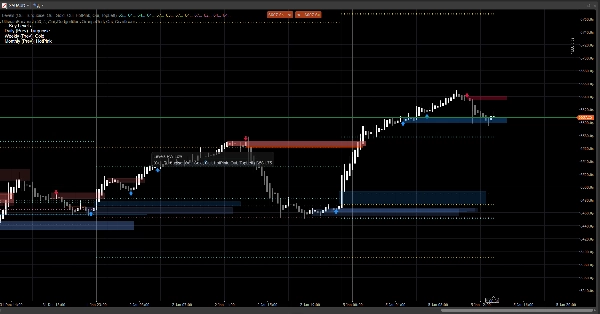
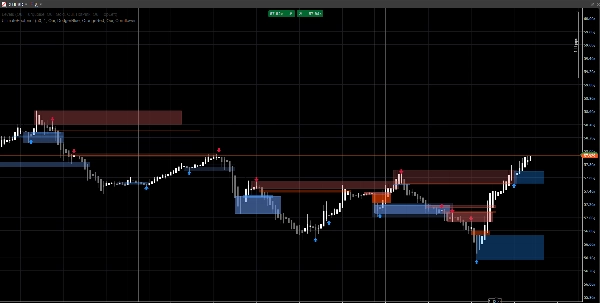
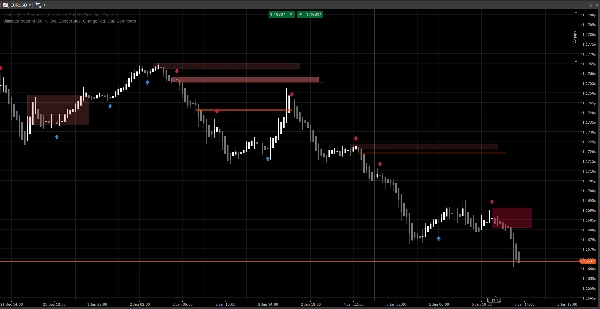
Чистая система структуры рынка, отображающая ценовые разрывы, блоки ордеров и сигналы на основе пробоя, с опциональным подтверждением объема и оповещениями о ретестах. Создана для ясности как на стандартных графиках, так и на Renko.
Этот индикатор сосредоточен на читаемости и исполнении, а не на загромождении. Зоны продлеваются вперед и автоматически управляются (истечение срока / аннулирование), помогая вам отслеживать важные уровни по мере развития цены.
Что он обнаруживает
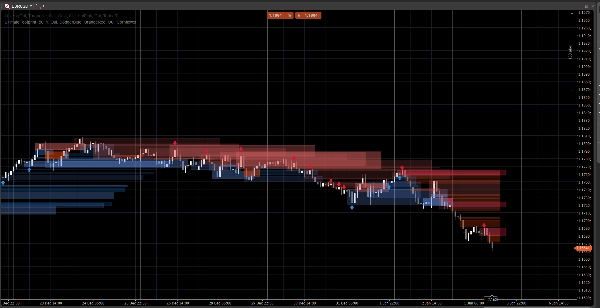
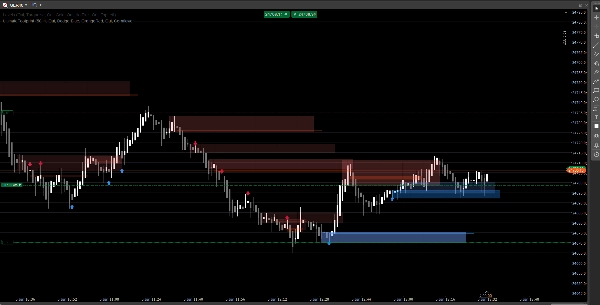
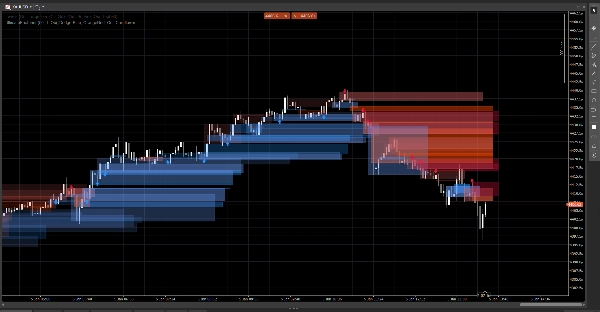
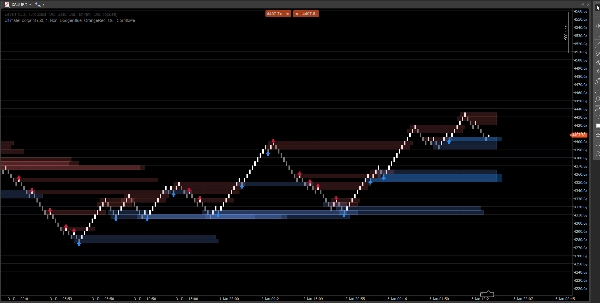
Ценовые разрывы (неэффективности на 3 бара)
- Выделяет бычьи и медвежьи разрывы прямо на графике
- Опциональное отображение (включение/выключение)
Блоки ордеров (последняя противоположная свеча перед смещением)
- Бычьи и медвежьи зоны OB
- Автоматически продлеваются вперед до аннулирования / достижения максимального расширения
Сигналы пробоя структуры (логика пробоя Swing)
- Обнаружение на основе пробоя с использованием Swing максимумов/минимумов
- Выводит стрелки сигналов (вверх/вниз) при подтверждении нового блока ордеров
Обновления в реальном времени
- Разработан для плавного обновления в живых условиях
- Работает на классических свечах и хорошо себя ведет на ценовом действии в стиле Renko
Умная фильтрация (опционально)
Подтверждение объема
- Вы можете требовать подтверждение Z-оценки объема перед валидацией сигнала блока ордеров
- Регулируемая базовая линия и чувствительность
Оповещения (опционально)
Включите оповещения для:
- Обнаружен новый блок ордеров
- Ретест блока ордеров с направлением (свеча отторжения)
Как использовать (простой рабочий процесс)
- Используйте ценовые разрывы и блоки ордеров как зоны реакции (области интереса).
- Пусть сигналы выделяют пробои структуры и соответствующее формирование OB.
- Используйте оповещения о ретестах для фиксации возвратов в зону с поведением отторжения.
- Комбинируйте с вашими собственными входами/выходами (управление рисками остается за вами).
Обзор входных параметров
Логика объема
- Базовая линия объема: период сглаживания, используемый для расчета Z-оценки
- Чувствительность объема: контролирует, насколько сильно объем влияет на видимость зоны
Ценовые разрывы
- Показывать ценовые разрывы
- Цвета бычьих / медвежьих разрывов
Блоки ордеров
- Показывать OB
- Цвета бычьих / медвежьих OB
- Максимальное расширение: насколько далеко зоны продлеваются вперед
Сигналы
- Показывать стрелки
- Период обзора Swing: определяет окно обнаружения Swing
- Требовать подтверждение объема (опционально)
- Порог объема + Период объема
- Цвета сигналов
- Прозрачность зоны
- Максимальное количество баров расширения (сигналы)
Оповещения
- Включить оповещения
- Оповещение о новом OB
- Оповещение о ретесте
Часто задаваемые вопросы
1) Перерисовывается ли он?
Нет.
Индикатор не «перемещает» исторические сигналы на новые места после закрытия бара.
- Зоны (пробелы / прямоугольники OB) создаются из исторических баров и затем продлеваются вперед.
- Сигналы (стрелки) подтверждаются на основе условий закрытого бара (пробой Swing + выбор OB).
После того, как стрелка выведена, она не перемещается задним числом.
Важный нюанс (нормальное поведение):
Пока текущий бар еще формируется, цены (High/Low/Close) могут изменяться. Это может вызвать:
- обновление расширения правого края зоны (визуальное расширение),
- условие ретеста может быть временно истинным, а затем ложным на том же формирующемся баре.
Это не перерисовка — это обновление в реальном времени на незавершенной свече.
2) В чем разница между «перерисовкой» и «перерисовкой» здесь?
Перерисовка = да (по замыслу).
Перерисовка = нет.
- Перерисовка означает, что прямоугольники перерисовываются/продлеваются на графике, чтобы зона продолжала проецироваться в будущее. Это необходимо для живого наложения в стиле «отпечатка».
- Перерисовка означала бы, что индикатор изменяет прошлые подтвержденные сигналы (стрелки/зоны) задним числом. Этого не происходит.
3) Почему зоны иногда меняют форму или прозрачность?
Потому что зоны взвешены по объему с использованием модели Z-оценки:
SMA(volume)+StdDev(volume)за ваш базовый период- прозрачность/альфа масштабируется в зависимости от отклонения объема
Так что если вы измените:
- Базовую линию объема
- Чувствительность объема
- или источник данных символа отличается
Визуальная интенсивность может отличаться. Расположение зоны остается основанным на цене; видимость может отражать контекст объема.
4) Почему иногда оповещения «пропадают» или «не срабатывают»?
Есть 3 технические причины, и все они намеренные:
A) Оповещения требуют строгого условия совпадения
Для оповещения о ретесте индикатор требует:
- цена перекрывает зону OB, И
- условие свечи отторжения выполнено (пример: бычье отторжение требует
Close > Open)
Если цена касается зоны, но закрывается нейтрально / противоположно, оповещение о ретесте не срабатывает.
B) Логика одноразового оповещения (антиспам)
Каждый OB имеет внутренний флаг (например, Alerted), чтобы вы не получали повторяющиеся оповещения на каждом тике.
Поэтому, если первое касание не соответствовало правилу отторжения, а позже оно соответствует, но флаг уже установлен (в зависимости от вашей версии), оповещение может казаться «выключенным».
C) Поведение типа графика (Renko / агрегация тиков)
На Renko «текущий кирпич» не является классической свечой. Во время формирования:
- Открытие/Закрытие могут быть нестабильными или равными
- логика ретеста может сработать внутри бара, но не подтвердиться при закрытии
В живой торговле для максимальной надежности:
- Оповещения о новых OB обычно чистые
- Оповещения о ретестах лучше рассматривать как оповещения о «подтвержденном отторжении» (а не просто касании фитиля)
5) Почему на скриншоте некоторые OB не показывают стрелку (или почему стрелка не соответствует каждому OB)?
Потому что зоны и стрелки — это разные механизмы:
- Зоны (прямоугольники OB) могут отображаться на основе логики обнаружения зон (OB, полученные из разрывов / зоны ценового действия).
- Стрелки выводятся только при обнаружении события структуры:
-
- пробит Swing максимум/минимум (пробой структуры),
- затем алгоритм ищет назад, чтобы найти последнюю противоположную свечу = действительный OB.
Поэтому вы можете увидеть зону OB без стрелки, если:
- не было подтвержденного пробоя Swing,
- кандидат OB не прошел фильтр объема (если он включен),
- или это зона, созданная механизмом разрывов, но не подтвержденная механизмом структуры.
Именно поэтому этот инструмент полезен:
Зоны дают вам карту. Стрелки выделяют моменты с наибольшим совпадением.
6) Могу ли я заставить OB всегда совпадать со стрелками?
Да, технически вы можете запустить его в режиме «только сигналы», отключив слой зоны, который не хотите видеть:
- Выключите ценовые разрывы, если хотите только зоны, основанные на структуре
- Выключите показ OB (зоны), если хотите только OB, подтвержденные стрелками
7) Работает ли он на всех таймфреймах и символах?
Да, но результаты зависят от:
- волатильности,
- ликвидности,
- качества объема тиков,
- и торговой сессии.
Криптовалюты и индексы ведут себя иначе, чем FX.
Примечания и отказ от ответственности
Этот индикатор является визуальным инструментом поддержки принятия решений, а не сервисом сигналов и не финансовой консультацией.
Все рынки и таймфреймы ведут себя по-разному — всегда проверяйте на своих данных и управляйте рисками соответствующим образом. Прошлое поведение не гарантирует будущих результатов.
Сводка
Отзывы покупателей
5 | 100 % | |
4 | 0 % | |
3 | 0 % | |
2 | 0 % | |
1 | 0 % |


