Описание
🚀 Превратите ваш график в стратегический центр принятия решений
Smart Tech Analysis — это не просто индикатор.
Это полноценная интеллектуальная панель анализа, разработанная для трейдеров, которые хотят ясности, точности и оперативности в принятии решений.
В то время как большинство индикаторов предоставляют только изолированную информацию, Smart Tech Analysis интегрирует:
✔ Тренд
✔ Объем
✔ Фибоначчи
✔ Уровни поддержки и сопротивления
✔ Технические сигналы
✔ Операционные рекомендации
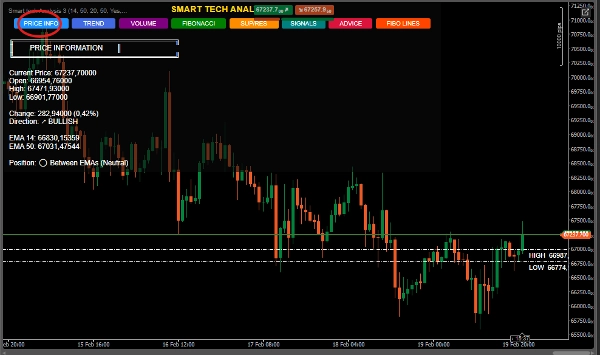
✔ Подробную информацию о цене
Всё в одной динамичной и интерактивной панели.
🔥 ОСНОВНОЕ ОТЛИЧИЕ
🎯 1. Система 6-в-1 – интегрированный анализ
Вам больше не нужно переключаться между множеством индикаторов.
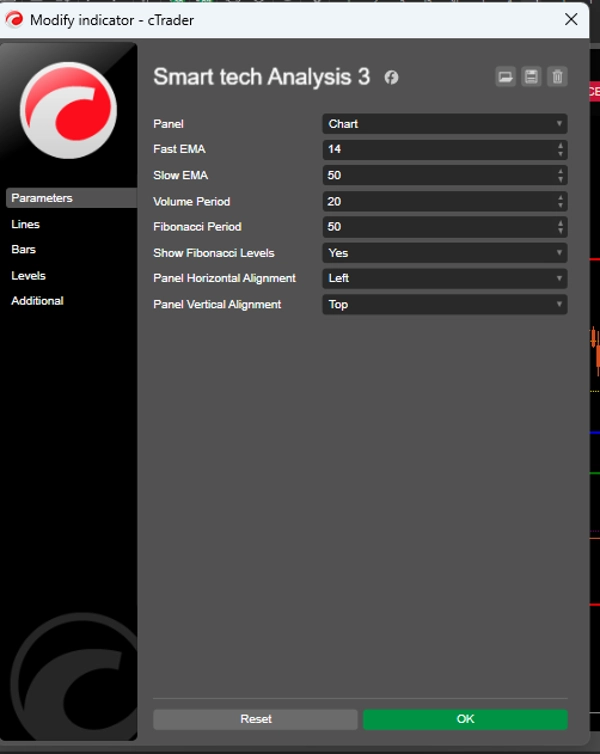
Smart Tech Analysis объединяет:
📈 Быстрые и медленные EMA (14 и 50)
📊 Объем с сравнительным анализом
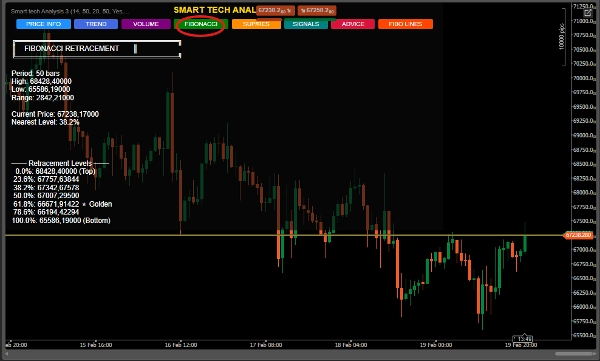
🧩 Автоматический Фибоначчи
🛡 Динамические уровни поддержки и сопротивления
🚦 Интеллектуальная генерация сигналов
📌 Рекомендации с рассчитанными стопом и целью
👉 Это снижает визуальный шум и повышает объективность.
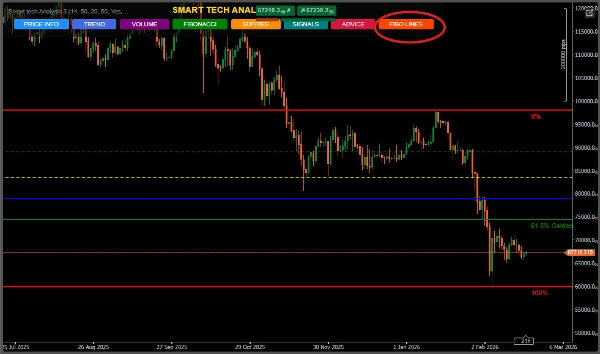
🧠 2. Эксклюзивная интерактивная панель
Профессиональный интерфейс с умными кнопками:
PRICE INFO
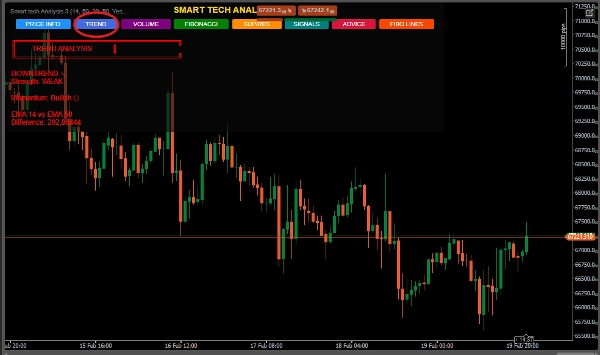
TREND
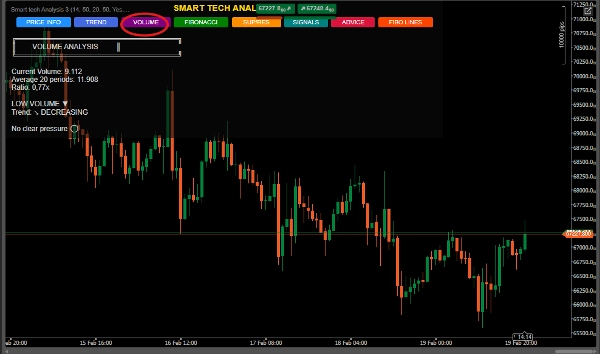
VOLUME
FIBONACCI
SUP/RES
SIGNALS
ADVICE
Трейдер выбирает именно то, что хочет видеть.
📌 Организация.
📌 Контроль.
📌 Профессионализм.
📈 3. Анализ тренда с силой и импульсом
Он не просто показывает, растет тренд или падает.
Он рассчитывает:
Интенсивность тренда
Процентную силу между EMA
Классификацию: слабый, умеренный или сильный
Это помогает избежать слабых входов на боковых рынках.
📊 4. Объем с институциональным чтением
Система определяет:
Экстремальный объем
Давление покупателей или продавцов
Ускорение или замедление
Сравнение с историческим средним
👉 Идеально для выявления возможной институциональной активности.
🧩 5. Автоматический Фибоначчи с золотой зоной
Вычисляется динамически за заданный период.
Особое выделение для:
⭐ Зоны 61,8% (золотая зона)
📌 Определение ближайшего уровня
📌 Бычьи и медвежьи расширения
📌 Автоматическая контекстная рекомендация
Идеально для трейдеров на откатах и свинг-трейдеров.
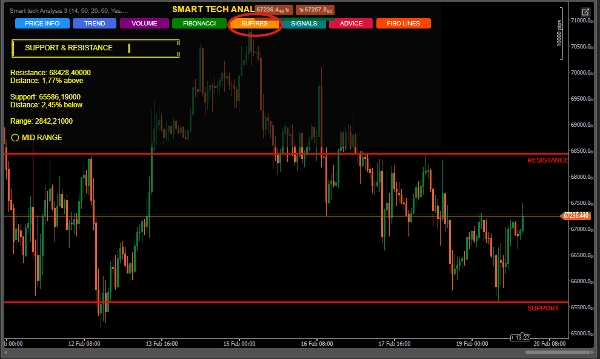
🛡 6. Интеллектуальные уровни поддержки и сопротивления
Обнаруживает важные максимумы и минимумы
Показывает процентное расстояние от текущей цены
Классифицирует положение: рядом с поддержкой, сопротивлением или в середине диапазона
Автоматически рисует линии на графике
Идеально для входа в стратегические зоны.
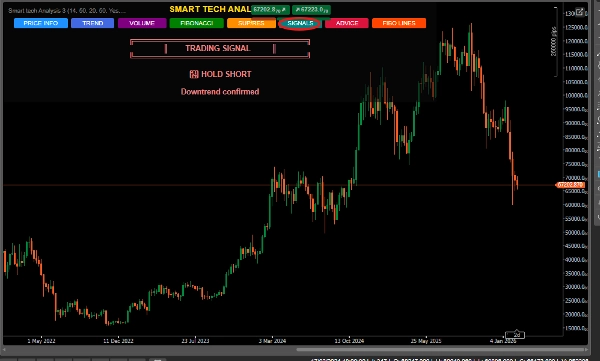
🚦 7. Система сигналов конвергенции
Алгоритм не генерирует случайные сигналы.
Он сочетает:
✔ Пересечение EMA
✔ Близость к поддержке/сопротивлению
✔ Структуру тренда
✔ Контекст цены
Классификация:
🟢 СИЛЬНАЯ ПОКУПКА
🔴 СИЛЬНАЯ ПРОДАЖА
📈 ДЕРЖАТЬ ЛОНГ
📉 ДЕРЖАТЬ ШОРТ
⏸ ЖДАТЬ
С указанным уровнем уверенности.
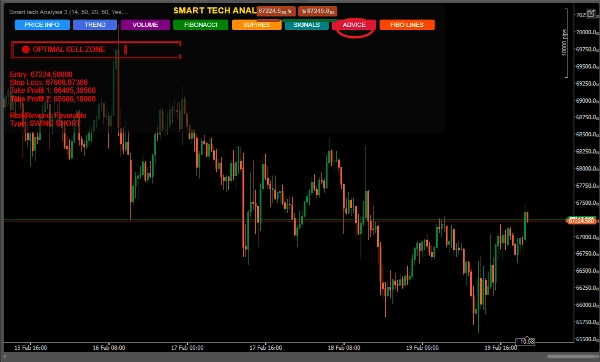
🎯 8. Рекомендации с управлением рисками
Панель "ADVICE" предоставляет:
Предложенный вход
Технический стоп-лосс
Две цели тейк-профита
Структура свинга (лонг или шорт)
Контекст операции
👉 Это не просто анализ.
👉 Это структурированный план.
🏆 Для кого этот индикатор?
✔ Новички, которым нужна ясность
✔ Трейдеры среднего уровня, ищущие конвергенцию
✔ Продвинутые трейдеры, стремящиеся к эффективности
✔ Свинг-трейдеры
✔ Скальперы, использующие структурное подтверждение
💎 Почему он выделяется на рынке? Обычные индикаторы Smart Tech Analysis
Изолированная информация Интегрированный анализ Визуальное загрязнение Организованная панель Нет контекста Техническая конвергенция Нет управления Предложенный стоп и цель Простые сигналы Сигналы с подтверждением
📊 Прямые преимущества
✔ Снижает эмоциональные решения
✔ Повышает точность
✔ Улучшает структурное восприятие
✔ Экономит время
✔ Повышает профессиональный уровень трейдера
🧠 Позиционирование на рынке
Smart Tech Analysis идеально подходит для:
Рынка Форекс
Индексов
Товаров
Криптовалют


