

Описание
Smart Money Suite Pro — Полный набор инструментов институционального Price Action для cTrader
Если вы торгуете, используя концепции smart money или любую методологию price action, основанную на институциональном потоке ордеров, вы знаете эту проблему: дюжина индикаторов разбросаны по вашему графику, каждый частично выполняет свою работу, но ни один из них не взаимодействует с другими. Smart Money Suite Pro был создан, чтобы полностью решить эту проблему.
Это единый, автономный индикатор, охватывающий все основные концепции институционального price action и методологии smart money — разработанный с нуля для cTrader, оптимизированный для плавной работы на живых графиках без мерцания и оснащённый удобными функциями, делающими его действительно пригодным для реальных торговых сессий.
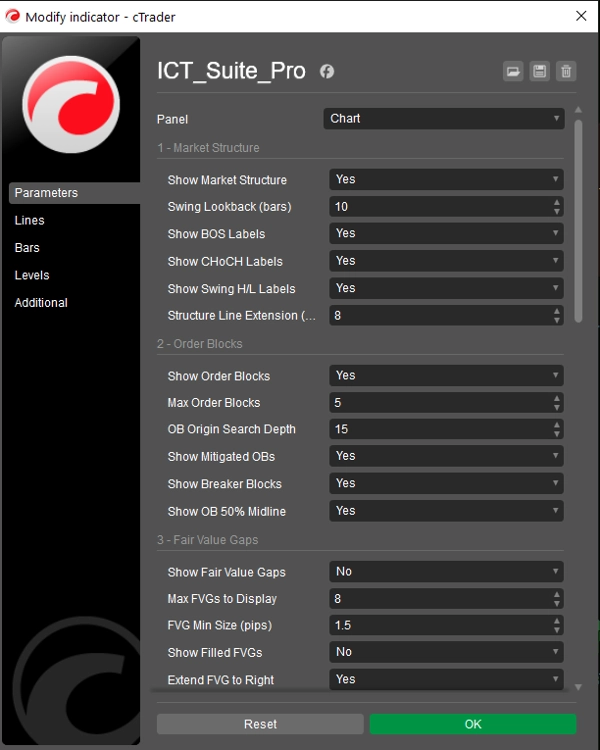
Структура рынка — Автоматическая и точная
Индикатор непрерывно сканирует ваш график на предмет подтверждённых локальных максимумов и минимумов, классифицируя каждый как Higher High, Lower High, Higher Low или Lower Low. Каждый Break of Structure (BOS) и Change of Character (CHoCH) обнаруживается и помечается пунктирной линией уровня, чтобы вы точно видели, где цена пробила предыдущую структуру. Различие между BOS (продолжение тренда) и CHoCH (разворот тренда) кодируется цветом, чтобы его можно было мгновенно распознать. Глубина анализа локальных экстремумов полностью настраивается.
Order Blocks — С полным отслеживанием жизненного цикла
Order blocks определяются путём поиска последней противоположной свечи перед каждым импульсным движением, приведшим к подтверждённому локальному экстремуму. Каждый блок отображается в виде цветного прямоугольника, простирающегося вправо от графика, чтобы вы могли сразу увидеть, вернулась ли цена в зону. Когда order block смягчается, прямоугольник удаляется и заменяется бледным текстовым маркером — сохраняя чистоту графика и при этом фиксируя уровень. Когда цена затем пробивает другую сторону смягчённого order block, он переклассифицируется как Breaker Block и перекрашивается, сигнализируя о потенциальной зоне разворота. Внутри каждого активного блока рисуется линия на 50% для выделения разделения премиум/дискаунт внутри самой зоны.
Fair Value Gaps — Отслеживаются до заполнения
Обнаруживаются трёхсвечные ценовые дисбалансы в обоих направлениях по всему вашему окну анализа. Каждый гэп фильтруется по настраиваемому минимальному размеру в пунктах, чтобы устранить шум. Незаполненные гэпы простираются вправо от графика до тех пор, пока цена не вернётся, чтобы их закрыть, после чего они либо удаляются, либо отмечаются как заполненные в зависимости от ваших настроек. Обрабатываются одновременно как бычьи, так и медвежьи дисбалансы.
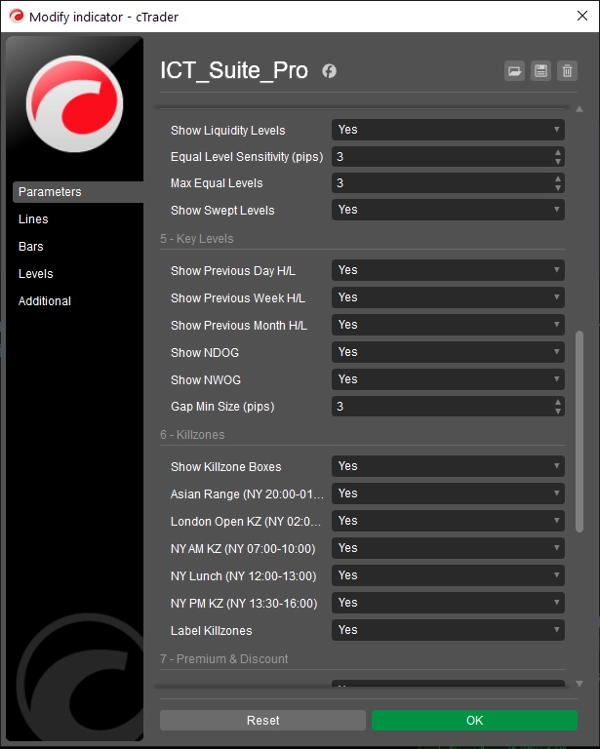
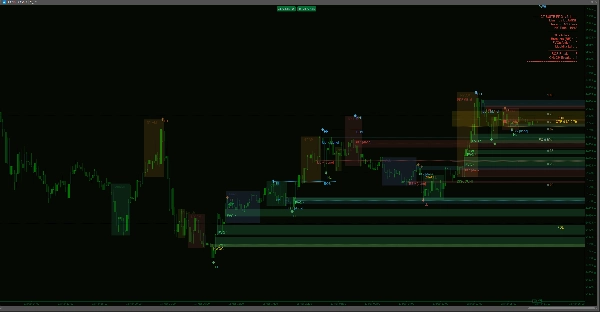
Уровни ликвидности — Равные максимумы и равные минимумы
Индикатор сканирует кластеры локальных максимумов или минимумов, расположенных в пределах настраиваемого допуска в пунктах — выявляя пулы ликвидности на стороне покупателей и продавцов, которые институциональный поток ордеров обычно нацеливает. Каждый уровень отображается с отметками на обоих локальных экстремумах и пунктирной линией, проецируемой вправо. После того как цена проходит через уровень ликвидности, он либо скрывается, либо отмечается как пройденный в зависимости от ваших предпочтений.
Ключевые уровни — Предыдущий день, неделя и месяц
Максимумы и минимумы предыдущего дня, недели и месяца автоматически рассчитываются на основе данных цены вашего графика. Все границы дат берутся из временных меток баров брокера — а не из системных часов вашего компьютера — поэтому они остаются точными независимо от вашего часового пояса или смены инструмента. Каждая пара уровней использует уникальный цвет и стиль линии, чтобы они аккуратно накладывались на график.
Открывающиеся гэпы — Дневные и недельные
Индикатор сканирует каждое дневное и недельное открытие на наличие ценового гэпа между закрытием предыдущей сессии и открытием текущей. Любой гэп, превышающий заданный вами минимальный размер в пунктах, отображается в виде цветного прямоугольника. Новые дневные и недельные открывающиеся гэпы различаются по цветам, давая вам мгновенное понимание, какие гэпы ещё не заполнены.
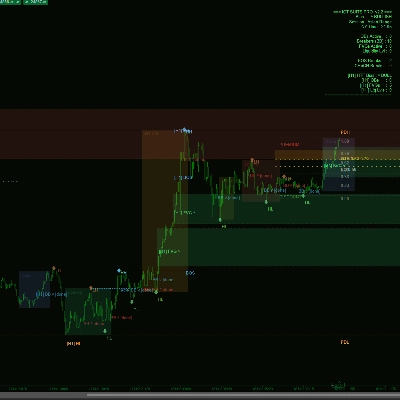
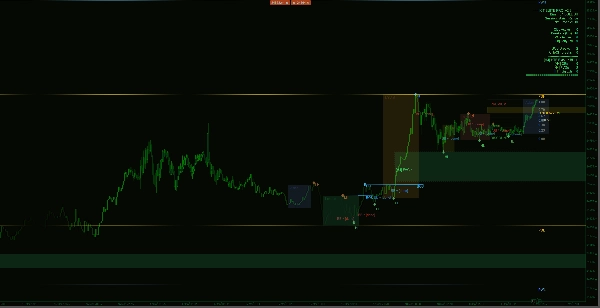
Сессионные зоны — С реальными диапазонами
Окна сессий Asian, London Open, New York AM, New York Lunch и New York PM отображаются в виде заполненных прямоугольников, охватывающих фактический диапазон от максимума до минимума, сформированный за каждый период. Время основано на Нью-Йоркском времени и автоматически корректируется с учётом перехода на летнее/зимнее время EDT/EST. Каждый прямоугольник можно включать и выключать отдельно, а также подписывать. Поскольку прямоугольники отражают фактический ценовой диапазон, а не фиксированные вертикальные линии, вы сразу видите, насколько активна была каждая сессия и где цена достигала своих экстремумов.
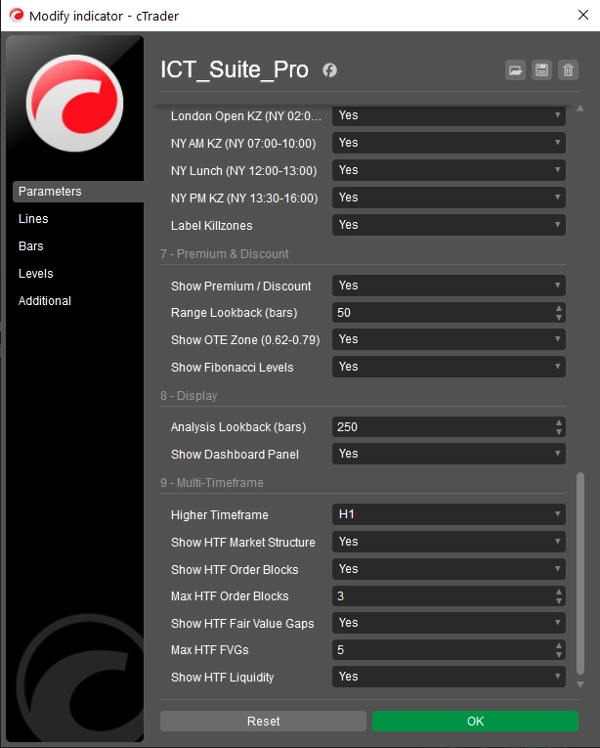
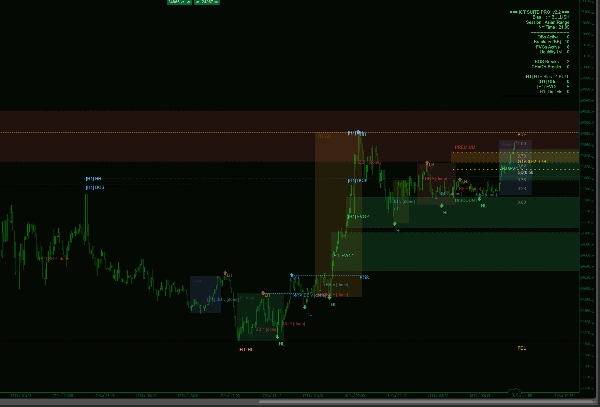
Зоны премиум и дискаунт — С оптимальным диапазоном входа
Анализ скользящего диапазона вычисляет самый высокий максимум и самый низкий минимум за настраиваемый период. Из этого диапазона индикатор рисует уровень равновесия (0.50), оптимальную зону входа (0.62–0.79 по Фибоначчи) и полный набор ключевых уровней коррекции Фибоначчи. Метки Premium и Discount размещаются внутри диапазона, чтобы вы всегда знали, в какой половине текущего торгового диапазона торгуется цена. Период анализа автоматически подстраивается под видимое окно баров, чтобы уровни никогда не ссылались на невидимые бары.
Наложение нескольких таймфреймов — Главная особенность
Система MTF реконструирует свечи более высокого таймфрейма, агрегируя бары текущего графика в временно выровненные слоты — отдельная подписка на данные не требуется. Выберите ваш более высокий таймфрейм из выпадающего списка (M5, M15, M30, H1, H4, D1), и Smart Money Suite Pro рассчитает и отобразит Order Blocks, Fair Value Gaps, Market Structure и Liquidity Levels более высокого таймфрейма прямо поверх вашего текущего графика. Элементы более высокого таймфрейма визуально отличаются: более толстые границы, пунктирные контуры и метки с префиксом таймфрейма (например, [H4] OB ^), чтобы вы всегда знали, к какому таймфрейму относится уровень.
Если вы выберете таймфрейм, который равен или ниже текущего — что невозможно — индикатор покажет на экране чёткое предупреждение и ничего не нарисует, предотвращая появление вводящих в заблуждение данных.
Панель управления обновляется с выделенным разделом для более высокого таймфрейма, когда наложение активно, показывая bias HTF, количество активных order blocks, количество fair value gaps и количество уровней ликвидности вместе с обзором текущего таймфрейма.
Живая панель управления
Чистая панель, закреплённая справа, отображает: текущий рыночный bias, активную торговую сессию, время Нью-Йорка, количество всех активных order blocks, breaker blocks, fair value gaps и уровней ликвидности, а также общее количество обнаруженных прорывов BOS и CHoCH в окне анализа. Когда включено наложение нескольких таймфреймов, автоматически добавляется сводка по более высокому таймфрейму ниже.
Создан для живой торговли
Индикатор перерисовывается только при формировании нового бара — а не на каждом входящем тике — устраняя мерцание графика, которое характерно для многих универсальных индикаторов. Весь анализ выполняется в настраиваемом окне анализа, поэтому производительность остаётся стабильной даже на низких таймфреймах с большим количеством баров.


