
Описание
SC RSI Dots
Минималистичный индикатор RSI с использованием динамических точек для более чистой и быстрой визуализации импульса.
SC RSI Dots — это минималистская интерпретация классического RSI (Индекс относительной силы), созданная для предоставления более чистого и интуитивно понятного взгляда на рыночный импульс без загромождения графика лишними линиями.
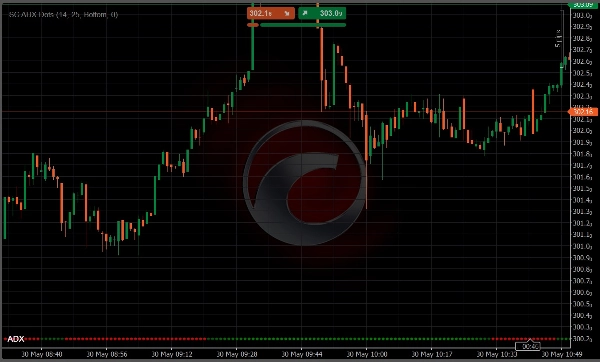
Вместо отображения традиционной линии RSI индикатор использует динамические точки для представления значений RSI во времени.
Этот подход создает более чистую, современную компоновку графика, которую легче читать, особенно для трейдеров, использующих несколько инструментов одновременно.
Ключевые особенности
- RSI отображается с помощью точек вместо линий
- Более чистый и менее отвлекающий внешний вид графика
- Динамическая цветовая визуализация в зависимости от положения RSI
- Специальный цвет для условий перепроданности
- Специальный цвет для условий перекупленности
- Постепенное усиление цвета по мере приближения RSI к крайним уровням
- Мгновенная визуальная идентификация смены импульса
- Быстрое распознавание силы и слабости рынка
- Идеально подходит для скальпинга, внутридневной торговли и дискреционной торговли
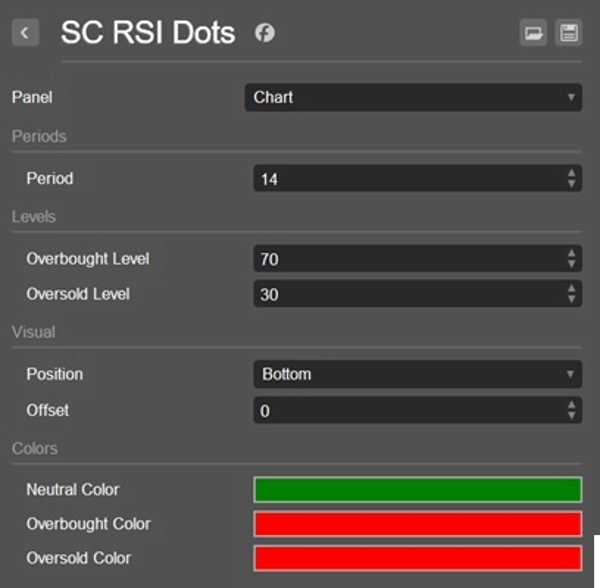
Как работает цветовая система
SC RSI Dots использует динамический цветовой движок для упрощения интерпретации RSI.
- Специальный цвет обозначает перепроданность.
- Специальный цвет обозначает перекупленность.
- Между этими двумя зонами интенсивность цвета постепенно увеличивается по мере приближения RSI к одному из крайних значений.
Этот визуальный подход позволяет трейдерам мгновенно понимать, где развивается импульс, без постоянного отслеживания традиционной линии осциллятора.
В результате получается более быстрое и интуитивное чтение условий RSI непосредственно с графика.
Почему стоит использовать SC RSI Dots
Традиционные индикаторы RSI часто требуют от трейдеров постоянного наблюдения за линией осциллятора и ее взаимодействием с уровнями перекупленности и перепроданности.
SC RSI Dots был создан с одной целью:
сохранять график визуально чистым, при этом предоставляя всю необходимую информацию об импульсе и рыночных условиях.
Адаптивная визуализация точек облегчает распознавание:
- Увеличивающегося бычьего импульса
- Увеличивающегося медвежьего импульса
- Приближения к условиям перекупленности
- Приближения к условиям перепроданности
- Потенциального истощения импульса
Все это без отвлекающих дополнительных линий на экране.
Идеально подходит для
- Трейдеров, предпочитающих чистые графики
- Трейдеров по импульсу
- Трейдеров, работающих с ценовым действием
- Скальперов и внутридневных трейдеров
- Торговых стратегий с несколькими индикаторами
- Быстрого анализа рынка
Важное замечание
SC RSI Dots предназначен для использования непосредственно на основном ценовом графике.
В отличие от традиционных индикаторов RSI, его визуальная концепция построена вокруг интеграции информации об импульсе в анализ ценового действия. По этой причине использование индикатора в отдельной панели не рекомендуется и не обеспечивает ожидаемого пользовательского опыта.
Просто. Чисто. Интуитивно.
Сводка
Key features include:
- RSI values represented by dots with dynamic colors reflecting momentum strength.
- Distinct colors for oversold and overbought conditions.
- Progressive color intensity indicating proximity to extreme RSI levels.
- Instant visual cues for momentum shifts, market strength, and weakness.
The indicator is suitable for scalping, intraday, momentum, and price action traders who prefer clean charts and use multiple tools simultaneously. It supports visualization of reversal signals, trend strength, and level touches or breaks based on RSI behavior. SC RSI Dots is intended for use on the main price chart rather than a separate panel, enhancing direct correlation between momentum and price movements.
Отзывы покупателей
5 | 100 % | |
4 | 0 % | |
3 | 0 % | |
2 | 0 % | |
1 | 0 % |


