Описание
Индикаторы Pinescriptlabs Store: 🤖Pinescriptlabs Store cBots:
SmartTrend Support & Resistance Lines Gold & BTC Breakout Session Pivots(новый) YieldShield" 🛡️
Dynamic Market Structure
Анализ поворотных точек
Fibonacci Linear
Регрессия на нескольких таймфреймах
Multi-Level Candle Bias
Трекер
Auto Support and
Resistance Trend Lines
All Support and
Resistance Levels
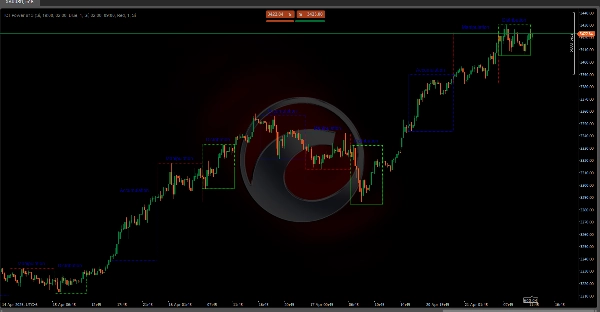
ICT POWER OF 3 ⚡📊
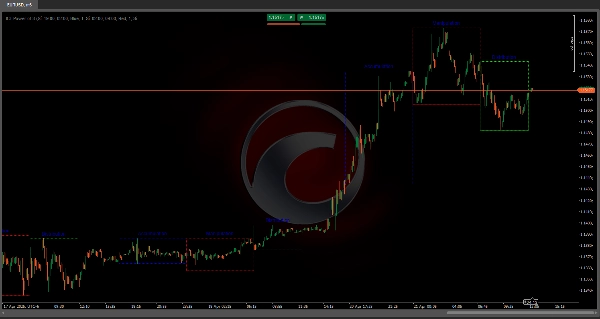
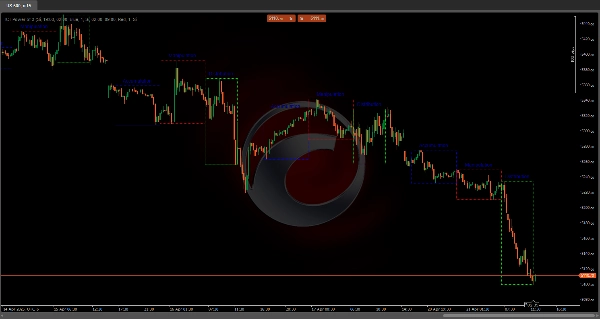
Этот индикатор автоматизирует теорию ICT "Power of 3", отображая на вашем графике три ключевые рыночные зоны —Аккумуляция, Манипуляция и Распределение — используя уточнённые таймфреймы, которые охватывают как чистые сессии, так и их перекрытия. В результате получается визуальная "карта" 🗺️, показывающая, где крупные игроки устанавливают поддержки, охотятся за стопами и двигают тренды —без необходимости ручного анализа свечей или теней!
Почему этот алгоритм важен в трейдинге 💡
Институциональная видимость 👀: Автоматизируя обнаружение зон, где "умные деньги" аккумулируют, манипулируют и распределяют, вы избавляетесь от догадок и мгновенно видите, куда течёт реальная ликвидность.
Обнаружение ловушек и ликвидности 🎯: Фаза Манипуляции (перекрытие Европы и Нью-Йорка) — это место, где происходят охоты за стопами — их обнаружение позволяет входить в сделки с меньшим риском.
Подтверждение тренда 🚀: Чистая зона распределения Нью-Йорка ловит суть направленного импульса — торговля в соответствии с ним повышает шансы на успех.
Последовательность 🔄: Использование фиксированных таймфреймов и стандартизированных визуальных элементов устраняет эмоциональные искажения и упрощает бэктестинг.
Обнаружение трёх фаз (с акцентом на перекрытия) 🔍
1️⃣ Аккумуляция (Азия + перекрытие Токио/Лондон: 19:00 – 2:00 EST)
- Начало ⏳: При первой свечи 19:00 EST открывается "коробка", фиксирующая начальный максимум/минимум.
- Отслеживание 🔄: Если цена пробивает диапазон (новый максимум/минимум), коробка расширяется в реальном времени.
- Закрытие 🚪: В 2:00 EST коробка фиксируется, отмечая, где умные деньги поглотили ордера с низкой волатильностью.
2️⃣ Манипуляция (Европа + перекрытие Лондон/Нью-Йорк: 2:00 – 9:00 EST)
- Начало ⏳: Обнаруживается при первой свечи 2:00 EST.
- Поведение 🎭: Подсвечивает ложные пробои предыдущих экстремумов — каждое отторжение визуально отслеживается.
- Закрытие 🚪: Завершается в 9:00 EST, показывая, где охоты за стопами были сосредоточены.
3️⃣ Распределение (Чистая сессия Нью-Йорка: 9:00 – 14:00 EST)
- Начало ⏳: Начинается с свечи 9:00 EST.
- Развитие 📈: Коробка растёт с самым сильным трендом — там, где институты освобождают позиции.
- Закрытие 🚪: Завершается в 14:00 EST, отмечая фазу с наибольшим импульсом и объёмом.
Управление днём и автоматическая очистка 🧹
Чтобы избежать захламления графика, индикатор сохраняет только последние N дней (настраиваемое значение). После превышения этого лимита он автоматически удаляет старые зоны — границы, заливки и метки — сохраняя ваш анализ чистым и сфокусированным на свежих данных.
Сводка
The indicator identifies:
1. Accumulation phase (7 PM – 2 AM EST, Asia + Tokyo/London overlap), marking where smart money absorbs orders with low volatility.
2. Manipulation phase (2 AM – 9 AM EST, Europe + London/New York overlap), highlighting false breakouts and stop hunts.
3. Distribution phase (9 AM – 2 PM EST, pure New York session), showing where institutions release positions during the highest momentum and volume.
ICT Power of 3 enhances trading by providing institutional visibility, trap and liquidity detection, and trend confirmation. It uses fixed timeframes and standardized visuals to reduce emotional bias and simplify backtesting. The indicator also manages chart clutter by automatically deleting old zones beyond a configurable number of days, keeping the analysis focused on recent data. It supports markets including commodities, cryptocurrencies (BTC, ETH), and symbols like BTCUSD and XAUUSD.
Отзывы покупателей
5 | 100 % | |
4 | 0 % | |
3 | 0 % | |
2 | 0 % | |
1 | 0 % |