Beschreibung
Der KasePeakOscillator (KPO) ist ein ausgeklügeltes Werkzeug der technischen Analyse, das entwickelt wurde, um Markterschöpfung, Trendwenden und Momentumverschiebungen zu identifizieren. Im Gegensatz zu Standardoszillatoren integriert der KPO statistische Volatilitätsmaße, um in unterschiedlichen Marktbedingungen zuverlässigere Signale zu liefern.
Funktionsweise: Der Indikator berechnet die Beziehung zwischen Kursbewegungen und historischer Volatilität (Durchschnittliche Tagesspanne/Standardabweichung). Er bewertet "Kurze Zyklen" gegenüber "Langen Zyklen", um zu bestimmen, ob eine Kursbewegung statistisch signifikant oder lediglich Marktrauschen ist. Das Ergebnis ist ein glatter, reaktionsschneller Oszillator, der um eine Nulllinie oszilliert.
Hauptkomponenten:
- Das Histogramm (KCD): Stellt das Kernmomentum dar. Ein Überschreiten der Nulllinie zeigt eine Änderung der kurzfristigen Trendneigung an.
- Dynamische Bänder (Oben/Mitte): Diese fungieren als statistische "überkauft" und "überverkauft" Schwellenwerte. Sie passen sich der Marktvolatilität an, dehnen sich in Phasen hoher Aktivität aus und ziehen sich während Konsolidierungen zusammen.
- Automatische Spitzen-Erkennung: Der Indikator identifiziert "Spitzen" und "Tiefs", bei denen das Momentum ein statistisches Extrem erreicht, was auf potenzielle Erschöpfung hinweist.
Handelsstrategie:
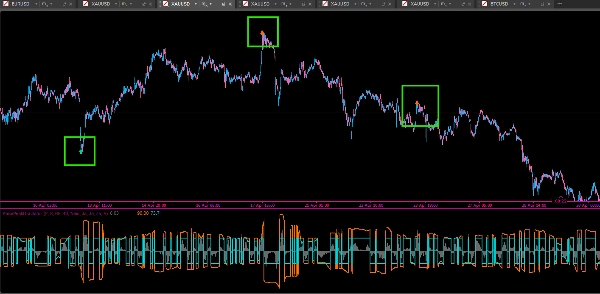
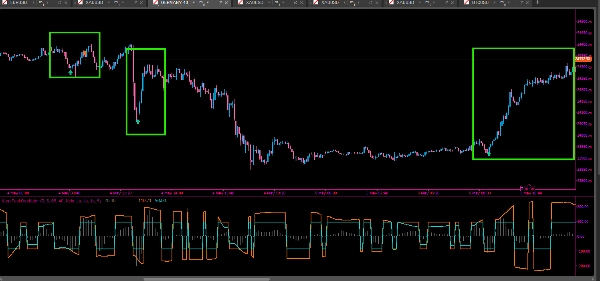
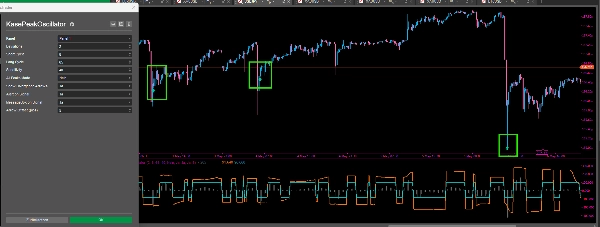
- Spitzenerschöpfung: Wenn ein Momentum-Peak außerhalb der dynamischen Bänder auftritt (angezeigt durch mintgrüne oder orangefarbene Pfeile), deutet dies darauf hin, dass der aktuelle Trend überdehnt ist und eine Umkehr oder Korrektur wahrscheinlich ist.
- Divergenzsignale: Der KPO erkennt automatisch bullische und bärische Divergenzen. Eine Divergenz tritt auf, wenn der Kurs ein neues Extrem erreicht, der Oszillator dies jedoch nicht tut, was auf ein nachlassendes Momentum hinweist. Diese sind mit Hellblau (bullisch) und Gold (bärisch) Symbolen gekennzeichnet.
- Trendbestätigung: Verwenden Sie die Position des Histogramms relativ zur Nulllinie, um die Trendrichtung zu bestätigen. Ein Verbleib über Null unterstützt Long-Positionen, während ein Verbleib unter Null Short-Positionen unterstützt.
Eigenschaften:
- Integriertes Alarmsystem (Ton, Nachrichtenfenster und visuelle Symbole).
- Einstellbare Empfindlichkeit zur Anpassung an verschiedene Anlageklassen (Forex, Indizes, Krypto).
- "Alle Spitzen Modus" für aggressives Scalping oder gefilterter Modus für Swing-Setups mit hoher Wahrscheinlichkeit.
Zusammenfassung
Key components include:
- Histogram (KCD): Represents core momentum; zero-line crossings indicate short-term trend changes.
- Dynamic Bands: Volatility-adjusted thresholds signaling overbought or oversold conditions.
- Automated Peak Detection: Identifies momentum extremes signaling potential trend exhaustion.
The KPO provides automated alerts for peak exhaustion and divergence signals, marking bullish and bearish divergences when price and momentum disagree. Trend direction can be confirmed by the histogram’s position relative to zero.
Features include adjustable sensitivity for various asset classes such as Forex, indices, and cryptocurrencies, an integrated alert system (sound, message, visual icons), and modes tailored for scalping or swing trading. The indicator supports analysis based on price bars and outputs reversal and divergence signals to assist in trading decisions.
Kundenbewertungen
5 | 100 % | |
4 | 0 % | |
3 | 0 % | |
2 | 0 % | |
1 | 0 % |