


Описание
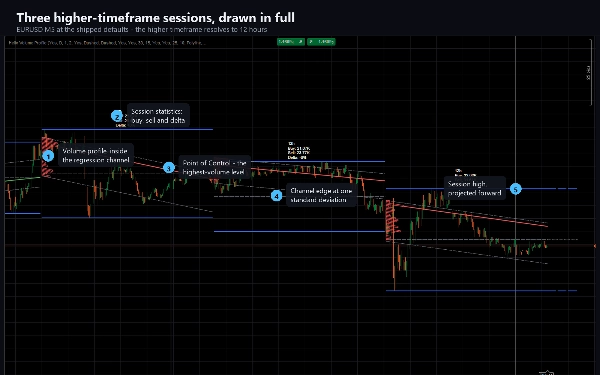
Helix Volume Profile строит полную картину сессии более высокого таймфрейма, в которую входит текущий график.
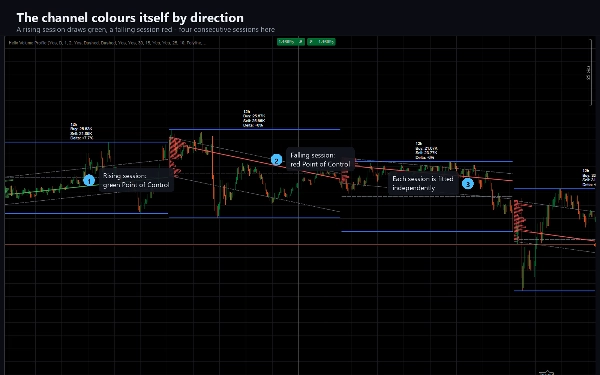
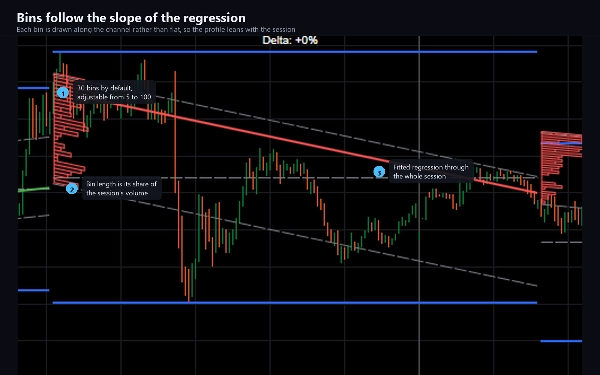
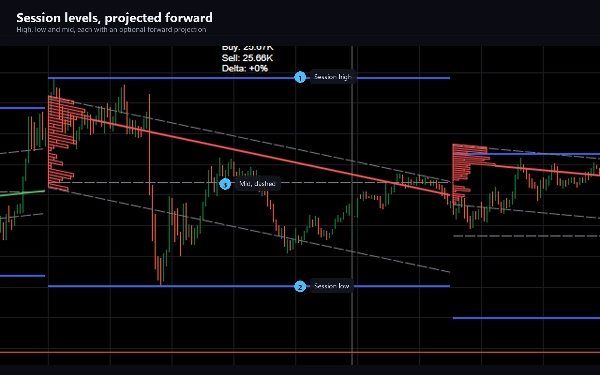
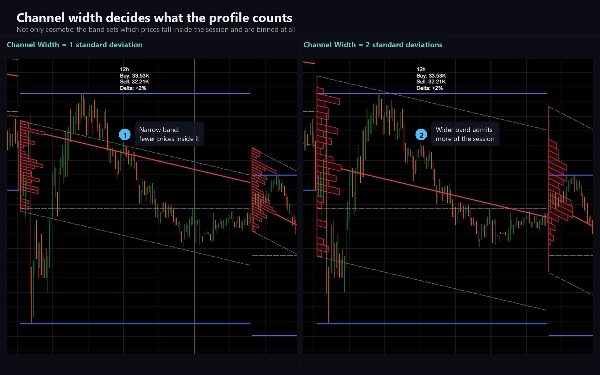
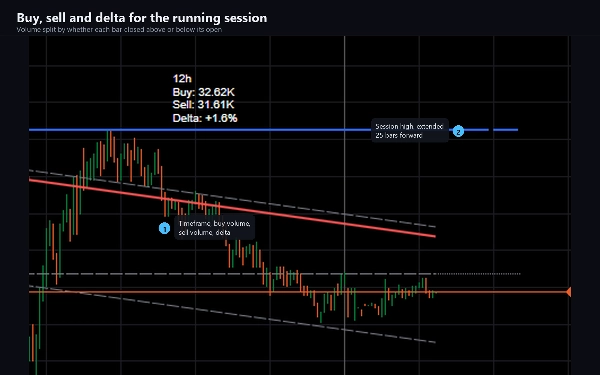
Для каждой сессии он подгоняет логарифмическую регрессию по каждому бару до текущего момента, рисует канал с настраиваемым числом стандартных отклонений вокруг неё и заполняет этот канал объемным профилем, чьи бины следуют наклону регрессии, а не лежат ровно. Бин с наибольшим объемом отмечен линией Point of Control, окрашенной в цвет направления движения канала. Высокий, низкий и средний уровни сессии отображаются рядом и могут быть проецированы вперёд, а компактная метка показывает объем покупок, объем продаж и дельту между ними.
Таймфрейм более высокого уровня выбирается для вас по умолчанию и адаптируется к графику: 12-часовая сессия на M5, четыре часа на M1, два дня на M15, неделя на H1, месяц на H4. Вы можете отключить это и задать сессию самостоятельно — принимаются минуты, дни, недели или месяцы.
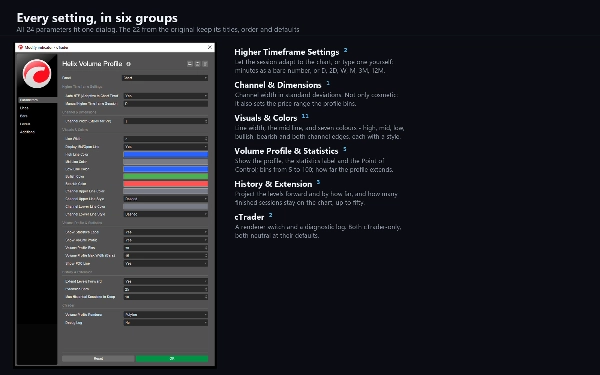
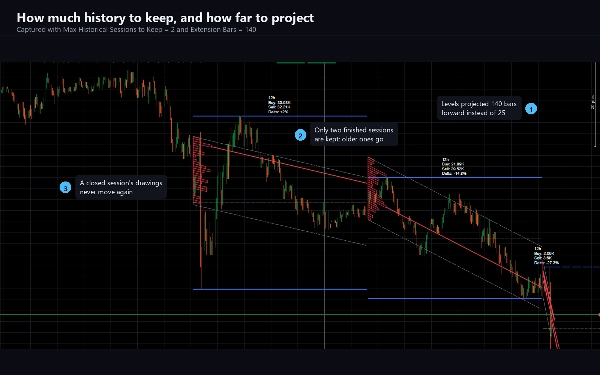
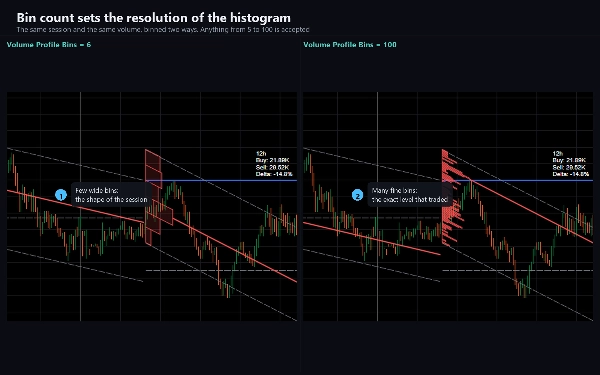
Всё настраивается. Ширина канала, количество бинов профиля от 5 до 100, насколько далеко простирается профиль, показывать ли Point of Control, метку статистики и проекции вперёд, ширина и стиль линий, семь цветов и сколько завершённых сессий остаётся на графике — до пятидесяти.
ДЛЯ ЧЕГО ЭТО НУЖНО
Чтение положения цены внутри структуры более высокого таймфрейма, не покидая рабочего таймфрейма. Канал показывает дрейф и рассеяние сессии; профиль показывает, где внутри неё действительно накопился объем; Point of Control отмечает уровень с наибольшей активностью. Трейдеры используют это для определения поддержки и сопротивления, оценки, насколько движение растянуто относительно сессии, и для понимания, доминировали ли покупки или продажи.
Подходит для любого инструмента и любого таймфрейма. Наиболее информативен на внутридневных графиках от M1 до H4, где адаптивная сессия даёт значимое окно; на дневных и выше сессию задавайте вручную.
КАК ОН ВЕДЁТ СЕБЯ
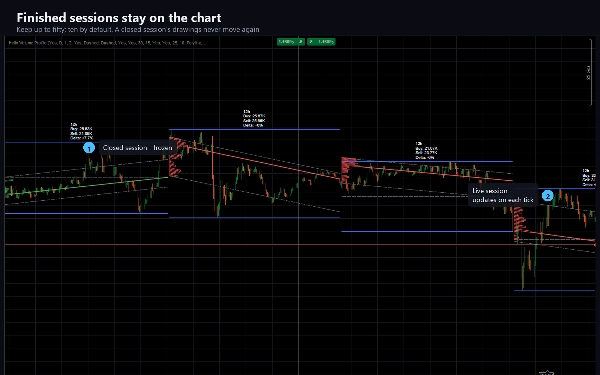
Живая сессия обновляется на каждом тике, и её рисунки движутся до закрытия сессии — канал перестраивается, профиль пересоздаётся, уровни переизмеряются с приходом каждого бара. После окончания сессии её рисунки замораживаются и больше не меняются. Это сделано специально, так работает метод; если вам нужны уровни, которые не меняются внутри бара, читайте закрытую сессию, а не живую.
Объем по символу форекс — это количество тиков, которые сообщает ваш брокер, поэтому профиль отражает ваш собственный фид.
ТЕХНИЧЕСКИЕ ДАННЫЕ
Индикатор, оверлей. 24 параметра. Нет разрешений на торговлю, нет доступа к файлам и сети — он построен с AccessRights, установленным в None, и не может размещать ордера. Включает пробную версию, ограниченную EURUSD без ограничения по времени и без отключённых функций.
Документация охватывает установку, каждый параметр с его назначением и руководство по устранению неполадок, объясняющее каждое поведение, которое может удивить пользователей.
Торговля связана с риском. Прошлые результаты не гарантируют будущих.
Сводка
The higher timeframe session adapts automatically based on the chart timeframe (e.g., 12 hours on M5, one week on H1) but can be manually set to minutes, days, weeks, or months. Users can customize channel width, number of volume bins (5 to 100), profile extension, visibility of elements, colors, line styles, and how many past sessions remain visible (up to 50).
The live session updates on every tick, recalculating the channel and volume profile until session close, after which the data is fixed. Volume data reflects the broker's tick count for forex symbols. Helix Volume Profile is suitable for any instrument and timeframe, with particular utility on intraday charts from M1 to H4. It includes 24 adjustable parameters and operates without trading permissions or network access.
Обсуждение
Отзывы покупателей
5 | 0 % | |
4 | 100 % | |
3 | 0 % | |
2 | 0 % | |
1 | 0 % |




























