present
Zarejestruj się i otrzymaj 50 $ zniżki na pierwszy zakup
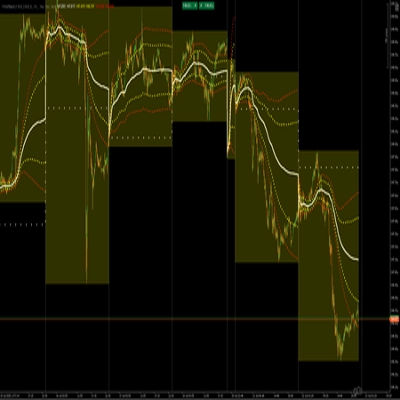
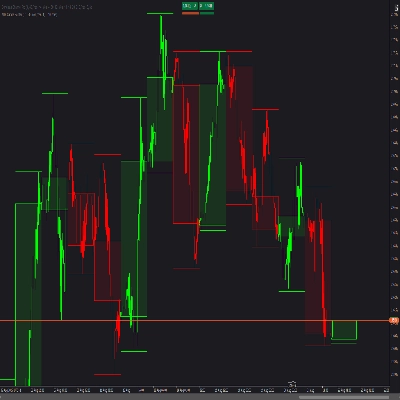
Trading product for fComparePriceMomentum Wskaźnik, image 1
fComparePriceMomentum
168
Bezpłatne instalacje

Opis

Podsumowanie

Profil wskaźnika

Dyskusja

Opinie klientów

0.0
Opinie: 0
Opinie klientów
Ten produkt nie ma jeszcze opinii. Wypróbowałeś(-aś) go już? Bądź pierwszy(-a) i powiedz o tym innym!

Częste pytania

Produkty dostępne za pośrednictwem cTrader Store, w tym boty handlowe, wskaźniki i wtyczki, dostarczane są przez deweloperów zewnętrznych i udostępniane wyłącznie w celach informacyjnych oraz w celu zapewnienia dostępu technicznego. cTrader Store nie jest brokerem i nie zapewnia doradztwa inwestycyjnego, nie udziela spersonalizowanych rekomendacji ani nie gwarantuje przyszłych wyników.

Więcej od tego autora
Intrinsic Recursive Value Indicator

Możesz także polubić

Ultra-Flexible VWAP Indicator with Advanced Customization
Multi-factor VWAP mean-reversion signals with ATR bands, volume exhaustion, and RSI gate on cTrader.
Based on market structure and draws liquidity zones, institutional flows, and consolidation ranges. Smart Money Concepts
Range-filter BUY/SELL signals scored by four confluence layers, with a stop, five targets and a trend panel
Gold Emperor: AI-driven XAUUSD dominance. Dynamic pivots, matrix trend logic, and institutional shield protection.
The Smooth Heiken Ashi indicator is a refined charting tool designed to filter out market noise and highlight true price
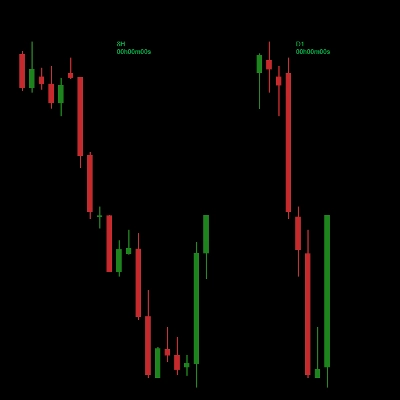
Perfect for traders who demand a clear overview of multiple timeframes at a glance.
BullBear Dynamics helps traders detect and interpret the balance between bullish and bearish momentum
Super Trend Rsi ,ATR + trend change distance + dynamic Alpha, divergence/convergence
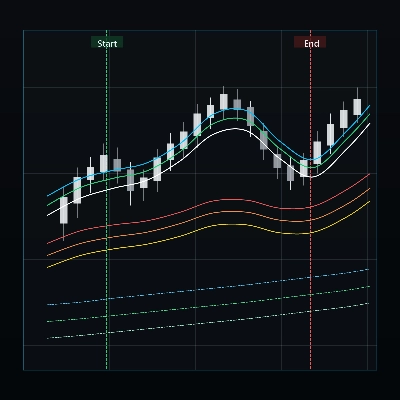
Multi-timeframe moving averages with session lines for structured trend analysis directly on the chart.
Instantly spot high-liquidity institutional moves with clean, non-obtrusive triangle alerts on cTrader charts.
Overlay HTF context on any chart: color bars by HTF and draw filled HTF bodies with optional High/Low lines.
View tick activity across a selected chart range with Point of Control, Value Area High and Value Area Low.
Awesome Oscillator with instant zero-line cross alerts. Includes chart popup + sound notification
Rejection-based volume profile with tiered heat zones, POC levels and a fully draggable anchor on cTrader.
See how price reaches your level with clear states, ATR distance, touch count, level wear and spread context.
📈 Initial Balance Breakout Signals: visually accurate IB levels, breakout alerts & forecast zones for smart trading.
Identify key support and resistance levels through detailed volume distribution analysis.

Cena

168
Bezpłatne instalacje