Описание
Индикатор кластеризации
Обзор
Индикатор кластеризации — это мощный инструмент, предназначенный для помощи трейдерам в выявлении шаблонов, трендов и аномалий в рыночных данных. Группируя похожие точки данных в кластеры, этот индикатор предоставляет ценные сведения, которые можно использовать для принятия обоснованных торговых решений.
Особенности
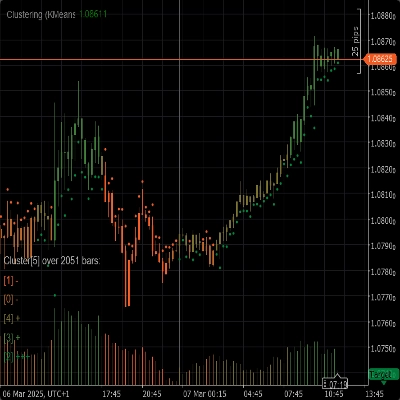
- Алгоритмы кластеризации: Использует продвинутые алгоритмы кластеризации, такие как K-Means и Gaussian Mixture Model (GMM), для эффективного сегментирования рыночных данных.
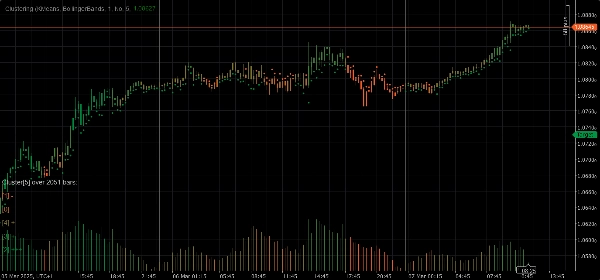
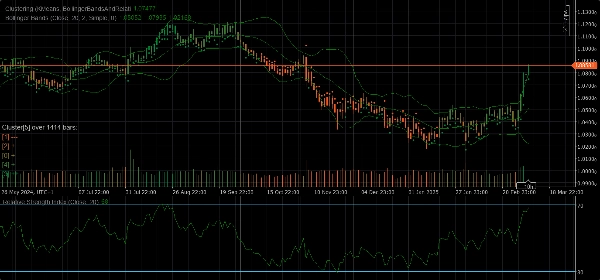
- Наборы признаков: Предлагает различные наборы признаков, включая исходную цену, полосы Боллинджера, индекс относительной силы (RSI), стохастический осциллятор, полосы Боллинджера и RSI, а также комбинации этих индикаторов для охвата различных аспектов рыночного поведения.
- Динамическая кластеризация: Автоматически определяет оптимальное количество кластеров, обеспечивая максимально точную кластеризацию.
- Визуализация: Обеспечивает четкое визуальное представление движений кластеров и волатильности непосредственно на вашем графике.
Параметры
- Алгоритм кластеризации: Выберите между K-Means или Gaussian Mixture Model (GMM) для наилучшего соответствия вашей торговой стратегии.
- Набор признаков: Выберите из исходной цены, полос Боллинджера, RSI, стохастического осциллятора, полос Боллинджера и RSI или полного набора рыночных данных с различными индикаторами.
- Окно: Определите количество баров, учитываемых для каждой точки данных.
- Авто K: Автоматически определяет количество кластеров на основе ваших данных.
- Начальное K: Установите начальное количество кластеров, если Авто K отключен.
- Максимальное количество исторических баров: Ограничьте максимальное количество исторических баров, используемых для кластеризации. Если установлено значение 0, используются все доступные бары.
- Цвет по кластерам: Включите или отключите перекраску графика на основе фактического распределения по кластерам.
- Показать сведения: Отображайте подробные сведения о каждом кластере непосредственно на графике.
- Показать индикаторы: Показывать индикаторы, используемые в наборах признаков.
Параметры автоадаптации
- Автоадаптация: Включите или отключите режим автоадаптации, который позволяет индикатору переинициализировать кластеры на основе заданных условий.
- Час автоадаптации: Час дня, когда может происходить автоадаптация (0-23).
- Период автоадаптации: Минимальное количество часов, которое должно пройти с момента последней адаптации, прежде чем может произойти следующая адаптация.
Параметры набора признаков
Параметры полос Боллинджера
- Период: Период для расчета полос Боллинджера.
- Отклонение: Множитель стандартного отклонения для полос Боллинджера.
- Тип скользящей средней: Тип скользящей средней, используемой в расчете полос Боллинджера (простая, экспоненциальная и т.д.).
Параметры индекса относительной силы (RSI)
- Период: Период для расчета RSI.
Параметры стохастического осциллятора
- Период: Период K для стохастического осциллятора.
- Замедление K: Фактор замедления K для стохастического осциллятора.
- Период D: Период D для стохастического осциллятора.
- Тип скользящей средней: Тип скользящей средней, используемой в расчете стохастического осциллятора (простая, экспоненциальная и т.д.).
- Тип расчета: Тип расчета для стохастического осциллятора (LowHigh, CloseClose и т.д.).
Использование
1. Добавьте индикатор кластеризации на ваш график.
2. Настройте параметры в соответствии с вашей торговой стратегией.
3. Анализируйте кластеры и их движения на графике.
4. Используйте предоставленные индикатором сведения для принятия обоснованных торговых решений.
Сводка
Отзывы покупателей
5 | 50 % | |
4 | 50 % | |
3 | 0 % | |
2 | 0 % | |
1 | 0 % |


