Opis
Linie ADR High & Low
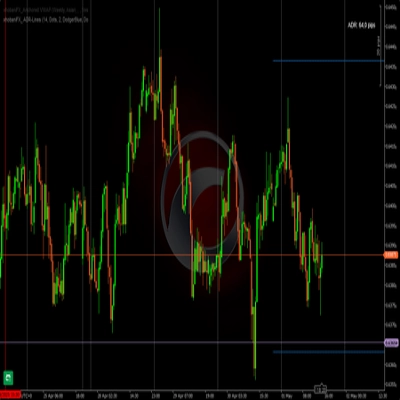
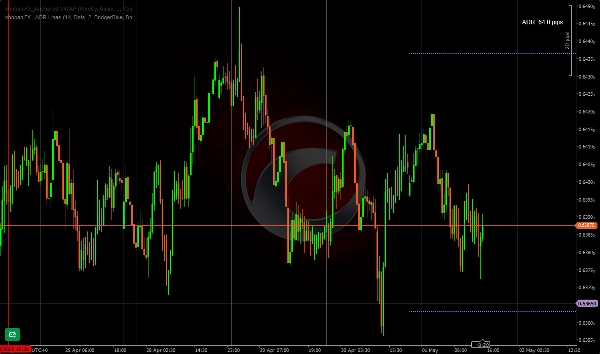
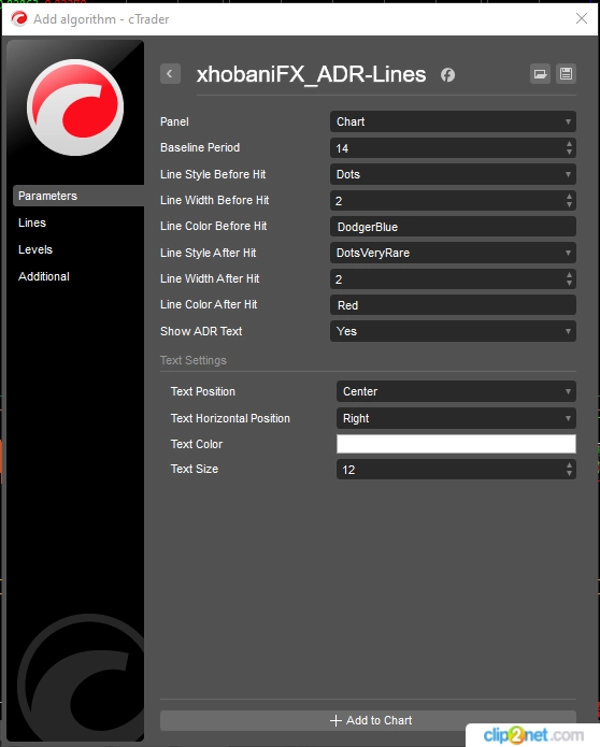
Ten wskaźnik ADR rysuje poziome linie dla dziennego minimum/maksimum na podstawie okresu preferowanego przez tradera. Ja lubię i używam 14 dni jako okresu bazowego. Jest to najbardziej odpowiednie dla skalperów/traderów intraday. Dzięki temu łatwo zauważyć, kiedy osiągnięto maksimum/minimum, możesz wybrać kolor/styl/szerokość linii, które zmienią się na inny wybrany przez Ciebie kolor po osiągnięciu poziomu.
Ten wskaźnik został opracowany w taki sposób, aby można było dostosować większość jego parametrów do własnych preferencji oraz dopasować do swojego środowiska pracy i kolorów.
Szczęśliwego handlu!
xhobani_FX
Podsumowanie
Podsumowanie AI
xhobaniFX_ADR-Lines is an Average Daily Range (ADR) indicator designed for scalpers and intraday traders. It plots horizontal lines representing the current day's high and low levels based on a user-defined period, with 14 days commonly used as a baseline. The indicator visually highlights when these high or low levels are reached by allowing customization of line color, style, and width to change upon being hit. Most parameters are adjustable to fit individual trading preferences and workspace aesthetics. This tool aids traders in quickly identifying key price levels within the trading day.
Profil wskaźnika
Opinie klientów
4.0
Opinie: 2
5 | 0 % | |
4 | 100 % | |
3 | 0 % | |
2 | 0 % | |
1 | 0 % |
Dyskusja
Częste pytania
Produkty dostępne za pośrednictwem cTrader Store, w tym boty handlowe, wskaźniki i wtyczki, dostarczane są przez deweloperów zewnętrznych i udostępniane wyłącznie w celach informacyjnych oraz w celu zapewnienia dostępu technicznego. cTrader Store nie jest brokerem i nie zapewnia doradztwa inwestycyjnego, nie udziela spersonalizowanych rekomendacji ani nie gwarantuje przyszłych wyników.


![Logo „[Stellar Strategies] Market Session Ultimate”](https://cdn.ctrader.com/image/webp/61ffd537-0125-4246-9e72-42eca1791d64_28232)


