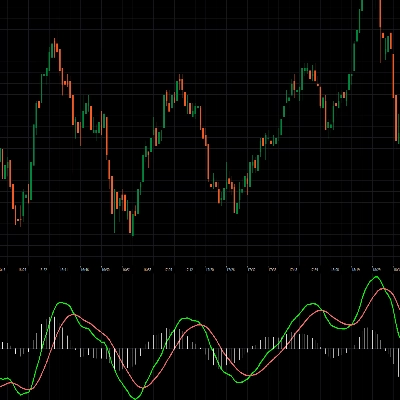
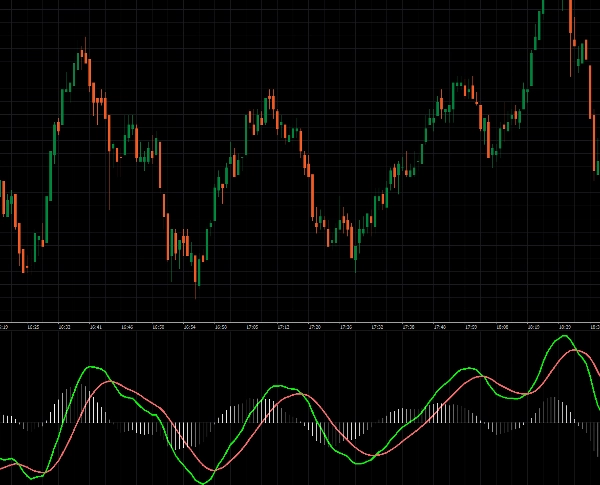
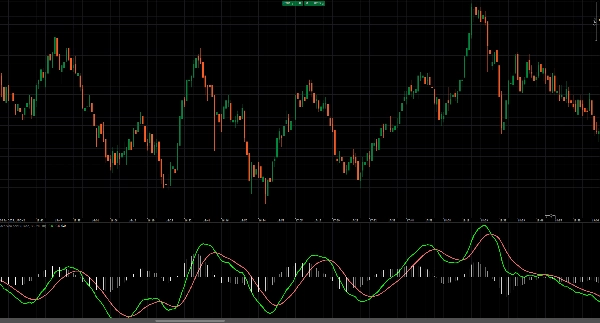
"Decision Point" โลโก้
Decision Point
0.0
03/09/2025
0
Desktop
"Decision Point" ภาพที่อัปโหลด"Decision Point" ภาพที่อัปโหลด
เพิ่มเติมจากผู้เขียนคนนี้
ยอดนิยม
Buy and sell indicator
Buy and Sell Signals
Coloring Trendline with arrows
Coloring trendline/ Colored Trendline / Color Trendline
ยอดนิยม
overbought oversold
Overbought Oversold Indicator
overbought oversold cbot
Overbought Oversold Cbot
นอกจากนี้คุณยังอาจชอบ
REDGREENZONEREVERSAL
The Red & Green Zone Reversal Indicator detects overbought and oversold market conditions using Bollinger Bands and RSI.
Ten Thousand Functions Bands Cloud(First Edition)
A metric that can set 1 to 3 groups of Bollinger Bands
ADX and ADI
This custom indicator is a complete implementation of the Average Directional Index and Directional Indicators.
Range 10 Rsi
RSI Scalping cBot: quick‑fire trades on choppy symbols.
Trinity StochX
Indicator Stochastic With RSI
IM_AngleIndicator
Indicator that calculates the slope of a moving average (SMA) and displays the value of the slope in degrees
Candle Timer & Strength Panel Demo -
Candle Timer & Strength Panel DEMO for cTrader DEMO VERSION – 24 hours free trial! This is a DEMO version of the Candle
ยอดนิยม
Buy and sell indicator
Buy and Sell Signals
PinBarCandlestickPattern
PinBarCandlestickPattern Indicator
Moving Average Plus
10 configurable moving averages: choose type, period, color per line; single price source for all.
VWAP & Sessions & D,W,M HLO Levels
Killzone Session With VWAP – Precision Meets Price Action
Chaikin Money Flow
Chaikin money flow's primary purpose is to distinguish between periods of accumulation and distribution of a security.
All Support and Resistance Levels
"Identify key market zones and visualize support/resistance from multiple timeframes on a single chart.
9-5-3 Trading Strat
Enhance Your Trading Strategy with the Larry Williams 9-5-3 Indicator
FREE Risk Reward Guardian Scalping Swing Intraday Assistant
Trade fearlessly: auto-adjusts order blocks, manages risks, and ensures precision. Was Free for early users now -80%
Advanced HTF Trend Buy & Sell Trading System
Detects breakouts 📈 auto-draws levels 🚀 confirms trends 🐻 dynamic signals 🎨 customizable for any asset & timeframe.
RT True Strength Index
Enhance trading with TSI! Use the True Strength Index for clear insights into market momentum and trend strength.
Simple MACD Histogram
Simple MACD Histogram with color-coded rising (green) and falling (red) momentum bars.