Market Swing Structure Pullback Pro
Indicatore
Versione 1.0, Sep 2025
Windows, Mac
Descrizione
"Il trading comporta dei rischi. Le performance passate non garantiscono risultati futuri."
Riepilogo
Riepilogo AI
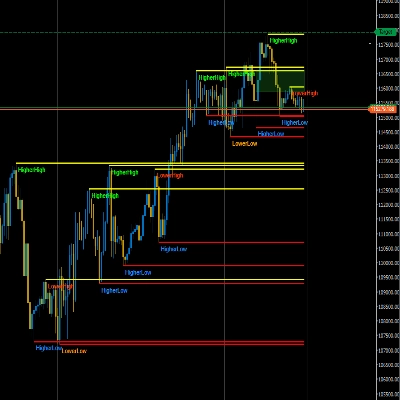
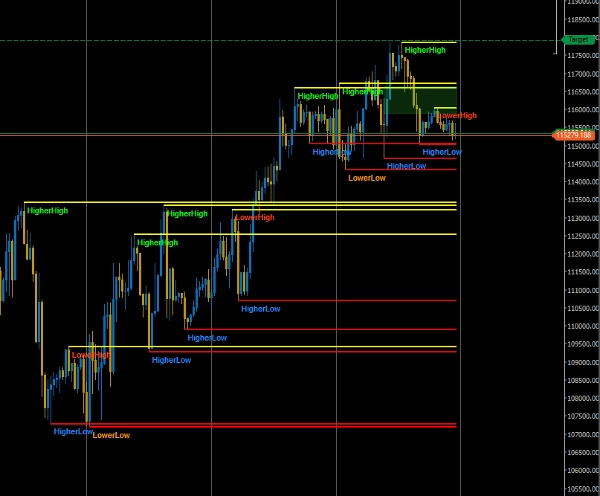
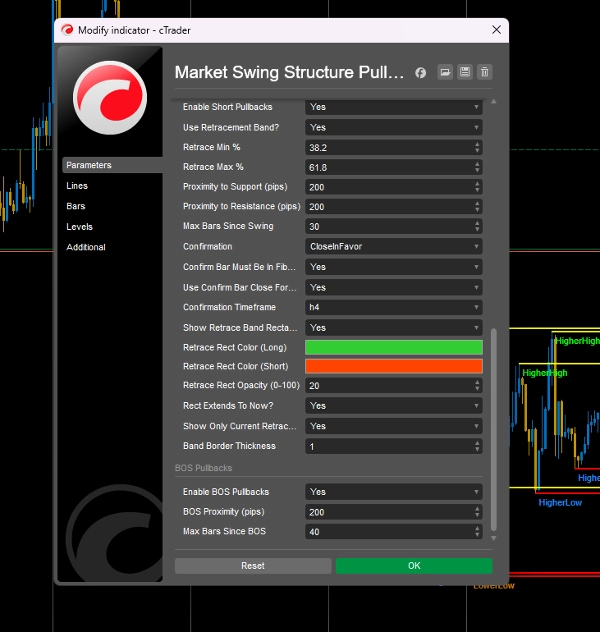
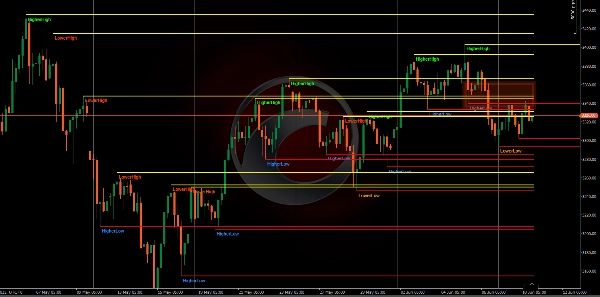
Market Swing Structure Pullback Pro is a trading indicator designed to automatically detect key market levels such as support and resistance and structural points. It highlights pullbacks and break of structure (BOS) retests, providing visual cues for potential trade entries. The indicator incorporates candle confirmation to filter signals, aiming to improve the accuracy of trade setups. It supports multiple markets including Forex, cryptocurrencies (e.g., BTCUSD, ETH), commodities (e.g., gold, oil), indices (e.g., NAS100, SP500), and stocks. Key features include automatic identification of swing structures, highlighting of pullback zones, and integration of candle pattern validation. This tool is intended for use on various symbols and timeframes to assist traders in identifying potential reversal or continuation points based on market structure analysis.
Profilo indicatore
Recensioni dei clienti
0.0
Recensioni: 0
Recensioni dei clienti
Questo prodotto non ha ancora ricevuto recensioni. L'hai già provato? Fallo sapere agli altri per primo!
Discussioni
Domande frequenti
BTCUSD
Forex
Signal
Breakout
Indices
EURUSD
Commodities
GBPUSD
NZDUSD
Prop
Supertrend
Crypto
Stocks
XAUUSD
NAS100
USDJPY
I prodotti disponibili tramite cTrader Store, inclusi bot di trading, indicatori e plugin, sono forniti da sviluppatori terzi e resi disponibili esclusivamente a scopo informativo e di accesso tecnico. cTrader Store non è un broker e non fornisce consulenze in materia di investimento, raccomandazioni individualizzate o garanzie di risultati futuri.


Prezzo
Da 31/10/2024
56
Vendite
1.75K
Installazioni gratuite