
คำอธิบาย
Trend Scope Pro เป็นตัวบ่งชี้ทางเทคนิคระดับมืออาชีพที่ออกแบบมาเพื่อให้ผู้ค้าเข้าใจโครงสร้างตลาดและทิศทางราคาลึกขึ้น สร้างขึ้นบนอัลกอริทึมการถดถอยเชิงเส้นขั้นสูง เครื่องมือนี้คำนวณเส้นถดถอยแบบไดนามิกพร้อมกับช่องเบี่ยงเบนมาตรฐานสามระดับ ด้วยการผสมผสานความแม่นยำทางสถิติกับความชัดเจนทางสายตา ช่วยให้คุณระบุแนวโน้มตลาดปัจจุบัน โซนที่อาจเกิดการกลับตัว และช่วงความผันผวนได้อย่างง่ายดาย ทำให้เป็นเครื่องมือที่เข้าถึงได้แต่ทรงพลังสำหรับชุดเครื่องมือการเทรดใดๆ
วิธีการอ่าน Trend Scope Pro
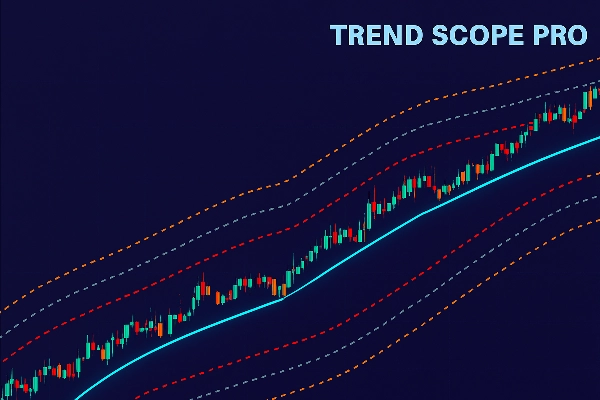
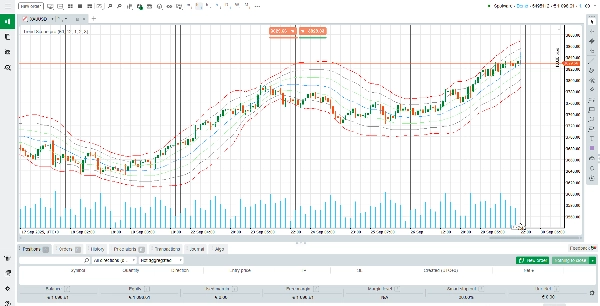
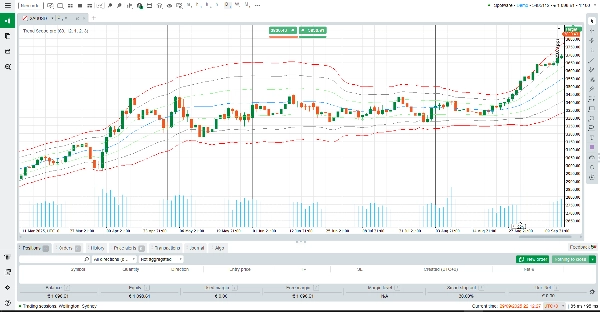
เมื่อใช้กับแผนภูมิของคุณ Trend Scope Pro จะวาดเส้นถดถอยกลาง (สีน้ำเงิน) ซึ่งแทนค่า “มูลค่ายุติธรรม” หรือทิศทางแนวโน้มเฉลี่ยในช่วงเวลาที่กำหนด รอบเส้นนี้จะมีการวาดชุดช่องบนและล่างสามชุด (สีส้ม เทา และแดง) แต่ละช่องคำนวณโดยใช้ตัวคูณเบี่ยงเบนมาตรฐานที่แตกต่างกัน:
บน/ล่าง 1 (สีส้ม): แทนเบี่ยงเบนมาตรฐานแรก การเคลื่อนไหวของราคาภายในโซนนี้มักสะท้อนความผันผวนระยะสั้นปกติ
บน/ล่าง 2 (สีเทา): แสดงถึงการเบี่ยงเบนที่แข็งแกร่งขึ้น การถึงโซนนี้มักบ่งชี้ถึงการเคลื่อนไหวที่ขยายตัวหรือโมเมนตัมที่กำลังพัฒนา
บน/ล่าง 3 (สีแดง): โซนสุดขีดที่ตลาดอาจอยู่ในภาวะซื้อมากเกินไปหรือขายมากเกินไป สร้างโอกาสในการกลับตัว
ในการใช้งานจริง ผู้ค้าสามารถใช้เส้นถดถอยเพื่อยืนยันทิศทางแนวโน้ม ในขณะที่ช่องทำหน้าที่เป็นระดับแนวรับและแนวต้านแบบไดนามิก ตัวอย่างเช่น:
ถ้าราคายังคงอยู่เหนือเส้นถดถอยอย่างสม่ำเสมอ แนวโน้มจะเป็นขาขึ้น
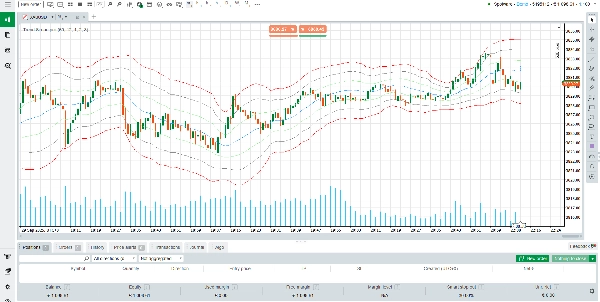
ถ้าราคาทดสอบหรือทะลุเส้นถดถอยซ้ำๆ แนวโน้มกำลังอ่อนตัวลง
การสัมผัสสุดขีดที่ช่องสีแดงอาจชี้จุดที่ตลาดอ่อนแรง ซึ่งมีโอกาสเกิดการกลับตัวหรือการดึงกลับสูงขึ้น
วิธีการทำงานของตัวบ่งชี้
Trend Scope Pro คำนวณเส้นถดถอยโดยวิเคราะห์ราคาปิดในช่วงเวลาที่เลือก จากนั้นวัดเบี่ยงเบนมาตรฐานของราคาจากเส้นนี้ ซึ่งกำหนดความกว้างของแต่ละช่อง วิธีการทางสถิตินี้ทำให้ตัวบ่งชี้ปรับตัวตามความผันผวนแบบเรียลไทม์ ให้ความสมดุลระหว่างสัญญาณตามแนวโน้มและข้อมูลเชิงลึกของการกลับสู่ค่าเฉลี่ย
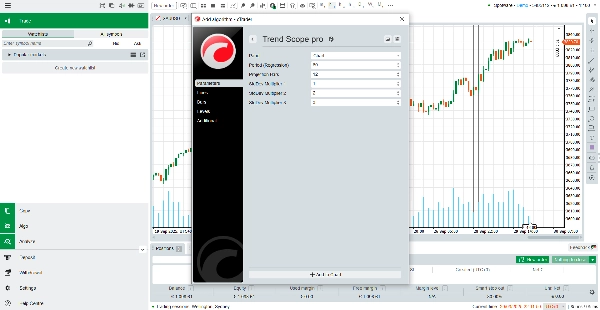
การตั้งค่าเริ่มต้น (60 แท่งย้อนหลัง ตัวคูณ 1.0, 2.0, 3.0) ได้รับการปรับให้เหมาะสมกับเครื่องมือส่วนใหญ่ แต่คุณสามารถปรับแต่งได้ง่ายเพื่อให้เหมาะกับกลยุทธ์หรือกรอบเวลาของคุณ ไม่ว่าคุณจะเป็นเทรดเดอร์รายวันที่มองหาการเข้าเทรดภายในวัน หรือเทรดเดอร์สวิงที่วิเคราะห์รอบตลาดกว้าง Trend Scope Pro ให้บริบทที่เชื่อถือได้สำหรับการตัดสินใจ
คุณสมบัติหลักของ Trend Scope Pro
การถดถอยเชิงเส้นแบบปรับตัว – คำนวณแนวโน้มตลาดกลางอย่างไดนามิกเพื่อความแม่นยำในการชี้ทิศทาง
ช่องหลายระดับ – ชุดแถบเบี่ยงเบนสามชุดช่วยระบุการเคลื่อนไหวปกติ แนวโน้มที่แข็งแกร่ง และสภาวะสุดขีด
ความชัดเจนทางสายตา – เส้นที่สะอาดและมีสีรหัสช่วยให้ง่ายต่อการตีความการเคลื่อนไหวของราคาในทันที
การตั้งค่าที่ปรับแต่งได้ – ช่วงเวลาย้อนหลังและตัวคูณเบี่ยงเบนที่ยืดหยุ่นเพื่อให้เข้ากับสไตล์การเทรดใดๆ
โดยสรุป Trend Scope Pro ผสมผสานความน่าเชื่อถือทางสถิติกับการใช้งานจริง มันไม่ใช่แค่เส้นแนวโน้มเท่านั้น แต่เป็นกรอบงานครบถ้วนสำหรับการวิเคราะห์พฤติกรรมราคา การระบุโซนที่มีโอกาสสูง และการปรับปรุงเวลาการเทรด ไม่ว่าคุณจะต้องการยืนยันแนวโน้ม คาดการณ์การกลับตัว หรือเพียงแค่เพิ่มโครงสร้างให้กับแผนภูมิ Trend Scope Pro มอบความชัดเจนและความมั่นใจที่คุณต้องการ
สรุป
รีวิวจากลูกค้า
5 | 50 % | |
4 | 50 % | |
3 | 0 % | |
2 | 0 % | |
1 | 0 % |


