Описание
Liquidity Pools — это продвинутый технический индикатор для платформы, который объединяет анализ ликвидности, объема и импульса в одном интуитивно понятном визуальном инструменте. Разработан для трейдеров, стремящихся выявлять сигналы, зоны ликвидности и высоковероятные точки разворота рынка. Подходит как для начинающих, так и для опытных трейдеров.
🚀 Основные функции
Многомерный анализ ликвидности
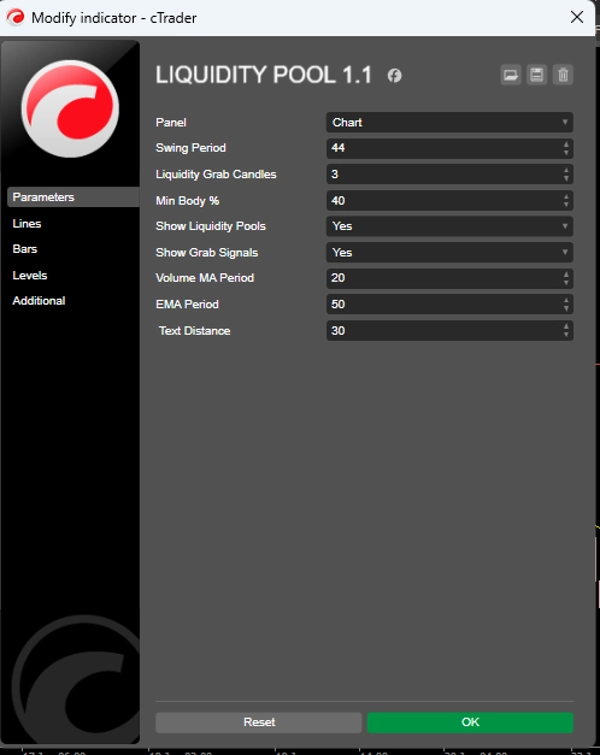
Обнаружение Swing High/Low с настраиваемым таймфреймом
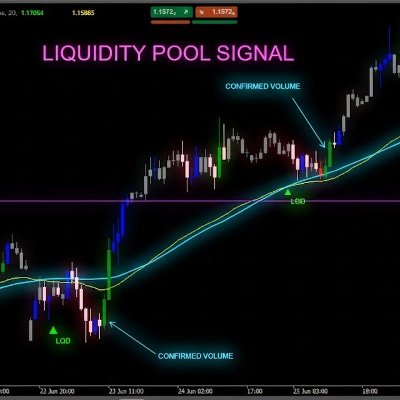
Визуальное определение пулов ликвидности с помощью иконок и текста
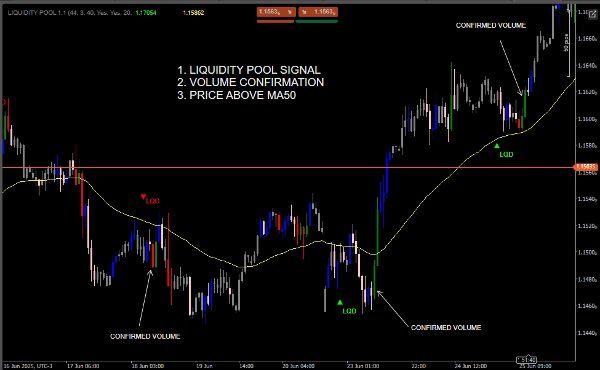
Сигналы захвата ликвидности с подтверждением объемом
Анализ профиля объема (PVA)
Интеллектуальное окрашивание свечей на основе относительного объема
Классификация объема: высокий, средний и низкий
Скользящая средняя объема для сравнения с базовой линией
Интегрированная система сигналов
Четкие визуальные сигналы (стрелки и цветные точки)
Фильтр EMA для подтверждения тренда


![Логотип продукта "[CB] Pivot Points Pro"](https://cdn.ctrader.com/image/webp/43463c82-67b0-4f10-a4ba-901bba091d81_32594)


