
RsiMultiFrameOBOS
อินดิเคเตอร์
เวอร์ชัน 1.0, Oct 2025
Windows, Mac
4.0
รีวิว: 1
คำอธิบาย
คำอธิบาย:
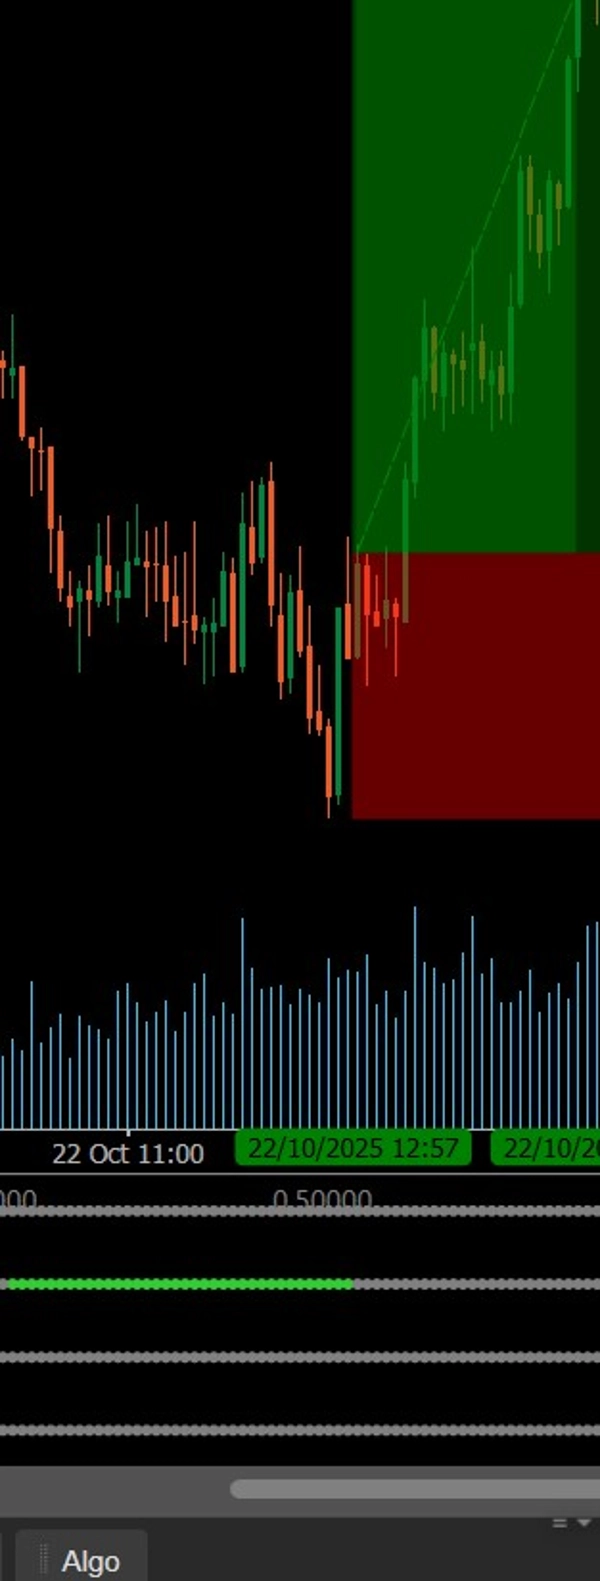
ตัวบ่งชี้นี้แสดงแนวโน้ม RSI ในสี่ช่วงเวลาที่ปรับแต่งได้โดยใช้จุดที่มีสีรหัส (สีเขียวสำหรับขายมากเกินไป สีแดงสำหรับซื้อมากเกินไป สีเทาสำหรับเป็นกลาง) ช่วยให้นักเทรดประเมินการจัดแนวโมเมนตัมตลาดได้ทันทีและระบุการยืนยัน RSI หลายช่วงเวลาสำหรับการเข้าซื้อที่แข็งแกร่งขึ้น
สรุป
โปรไฟล์อินดิเคเตอร์
รีวิวจากลูกค้า
4.0
รีวิว: 1
5 | 0 % | |
4 | 100 % | |
3 | 0 % | |
2 | 0 % | |
1 | 0 % |
รีวิวจากลูกค้า
November 8, 2025
A few signals across sessions tell more, and the review screen feels calmer.
การสนทนา
คำถามที่พบบ่อย
BTCUSD
Prop
Forex
Scalping
Indices
EURUSD
Commodities
RSI
Crypto
Stocks
XAUUSD
Martingale
ผลิตภัณฑ์ที่มีให้บริการผ่าน cTrader Store รวมถึงบอทการเทรด อินดิเคเตอร์ และปลั๊กอิน มีให้บริการโดยนักพัฒนาบุคคลที่สามและมีไว้เพื่อวัตถุประสงค์ในการเข้าถึงข้อมูลและทางเทคนิคเท่านั้น cTrader Store ไม่ใช่โบรกเกอร์และไม่ได้ให้คำแนะนำการลงทุน คำแนะนำส่วนบุคคล หรือการรับประกันผลการดำเนินงานในอนาคต
เพิ่มเติมจากผู้เขียนคนนี้


ราคา
ตั้งแต่ 21/01/2025
3
การขาย