คำอธิบาย
ตัวชี้วัด TECHNICAL ANALYSIS เป็นโซลูชันการวิเคราะห์ทางเทคนิคขั้นสูงที่พัฒนาสำหรับแพลตฟอร์ม cAlgo โดยผสานรวมตัวชี้วัดทางเทคนิคหลายตัวที่มุ่งเน้นการระบุแนวโน้มที่แข็งแกร่ง แรงผลักดันของตลาด และการยืนยันปริมาณ มันรวม ADX (Average Directional Index) กับการวิเคราะห์ความชัน การกรองปริมาณ และการวิเคราะห์ทางเทคนิคหลายตัวชี้วัดแบบเรียลไทม์ เพื่อมอบมุมมองที่ครอบคลุมและเชื่อถือได้สำหรับการตัดสินใจของเทรดเดอร์
🔍 กลยุทธ์หลัก
1. ฐาน: ADX + DI (Directional Movement System)
แกนหลักของตัวชี้วัดคือ ADX (Average Directional Index) ซึ่งวัดความแข็งแกร่งของแนวโน้ม
ส่วนประกอบ +DI (Positive Directional Indicator) และ -DI (Negative Directional Indicator) ระบุทิศทางของแนวโน้ม:
+DI > -DI → แนวโน้มขาขึ้น
-DI > +DI → แนวโน้มขาลง
2. การวิเคราะห์แรงผลักดันแบบไดนามิกด้วยความชัน
ความชันของ ADX, +DI และ -DI ถูกคำนวณโดยใช้การถดถอยเชิงเส้น
สิ่งนี้ช่วยให้ระบุได้ว่าแนวโน้มกำลัง:
เพิ่มความแข็งแกร่ง (ความชันบวก)
ลดความแข็งแกร่ง (ความชันลบ)
3. ระดับอ้างอิง
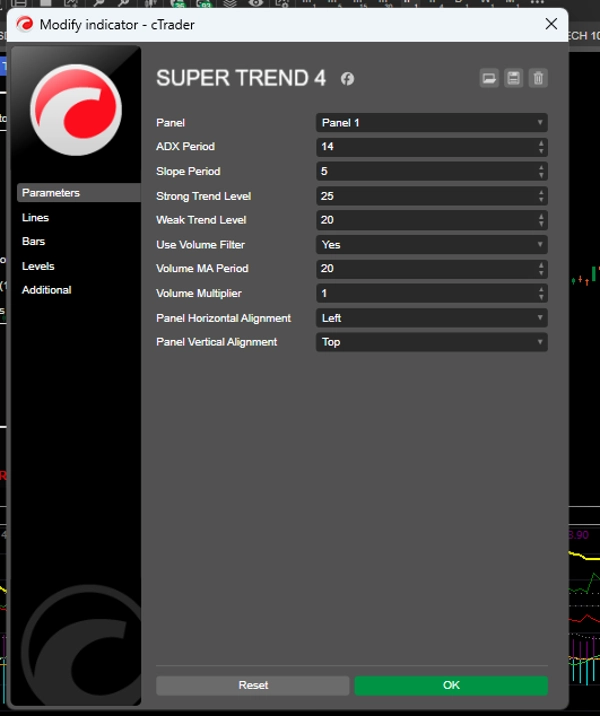
ระดับแนวโน้มแข็งแกร่ง: ระดับที่สูงกว่าซึ่งแนวโน้มถือว่าแข็งแกร่ง (ค่าเริ่มต้น: 25)
ระดับแนวโน้มอ่อนแอ: ระดับขั้นต่ำที่พิจารณาว่าเป็นแนวโน้มที่ถูกต้อง (ค่าเริ่มต้น: 20)
แนวโน้มที่ต่ำกว่าระดับอ่อนแอจะถูกพิจารณาว่าเป็นแนวโน้มด้านข้างหรือไม่มีทิศทางที่ชัดเจน
📈 การสร้างสัญญาณ
เงื่อนไขการซื้อ
✅ +DI ตัดขึ้นเหนือ -DI
✅ ADX อยู่เหนือระดับแนวโน้มอ่อนแอ (Weak Trend Level)
✅ ความชันของ ADX และ +DI เป็นบวก
✅ การยืนยันปริมาณ (ไม่บังคับ)
เงื่อนไขการขาย
✅ -DI ตัดขึ้นเหนือ +DI
✅ ADX อยู่เหนือระดับแนวโน้มอ่อนแอ (Weak Trend Level)
✅ ความชันของ ADX และ -DI เป็นบวก
✅ การยืนยันปริมาณ (ไม่บังคับ)
สัญญาณที่แข็งแกร่ง: เมื่อ ADX อยู่เหนือระดับแนวโน้มแข็งแกร่งและความชันเป็นบวกอย่างมีนัยสำคัญ ตัวชี้วัดจะสร้างสัญญาณที่เสริมความแข็งแกร่ง หลีกเลี่ยงการเข้าซ้ำติดต่อกัน 📊 ตัวกรองปริมาณ (ไม่บังคับ)
ตัวชี้วัดอาจต้องการการยืนยันปริมาณก่อนสร้างสัญญาณ
ปริมาณปัจจุบันต้องมากกว่าหรือเท่ากับค่าเฉลี่ยเคลื่อนที่ของปริมาณ × ตัวคูณ
สิ่งนี้ช่วยกรองการเบรกเอาต์และสัญญาณเท็จในตลาดที่มีสภาพคล่องต่ำ
🧠 การวิเคราะห์ทางเทคนิคขั้นสูง (แผงโต้ตอบ)
TECHNICAL ANALYSIS รวมแผงโต้ตอบสองแผงบนกราฟ:
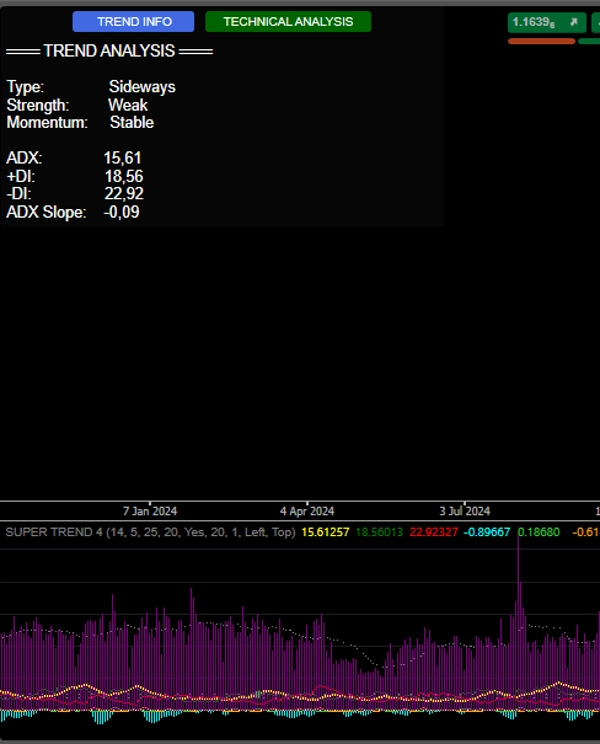
1. ข้อมูลแนวโน้ม (TREND INFO)
ประเภทแนวโน้ม: แนวโน้มขาขึ้น / แนวโน้มขาลง / แนวโน้มด้านข้าง
ความแข็งแกร่งของแนวโน้ม: แข็งแกร่ง / อ่อนแอ
แรงผลักดัน: กำลังเพิ่ม / กำลังลด / คงที่
ค่าปัจจุบันของ ADX, +DI, -DI และความชัน
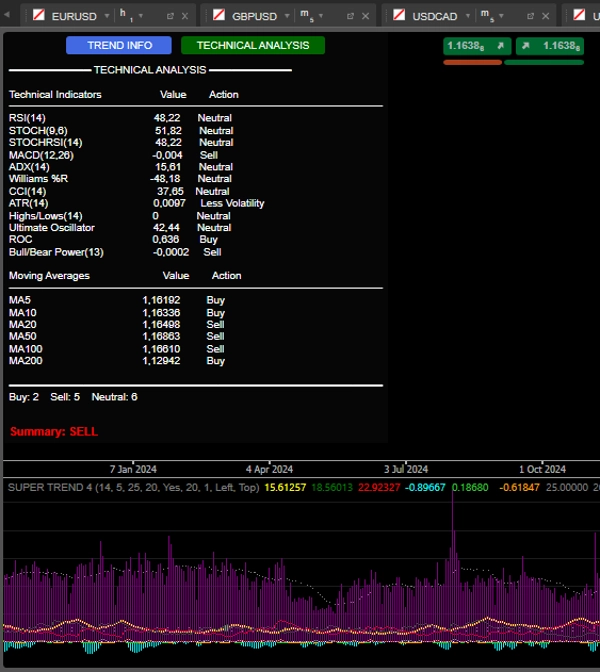
2. การวิเคราะห์ทางเทคนิค (TECHNICAL ANALYSIS)
ทำการวิเคราะห์หลายตัวชี้วัดแบบเรียลไทม์ รวมถึง:
RSI(14) – ซื้อมาก/ขายมากเกินไป
Stochastic(14) – แรงผลักดัน
MACD(12,26) – การตัดกันและความแตกต่าง
Williams %R – จุดสุดขีดของตลาด
CCI(14) – ความเบี่ยงเบนจากราคาปกติ
ROC(12) – อัตราการเปลี่ยนแปลง
Ultimate Oscillator – การยืนยันความแข็งแกร่ง
Bull/Bear Power – แรงกดดันซื้อ/ขาย
ค่าเฉลี่ยเคลื่อนที่ (5,10,20,50,100,200) – แนวโน้มระยะยาว
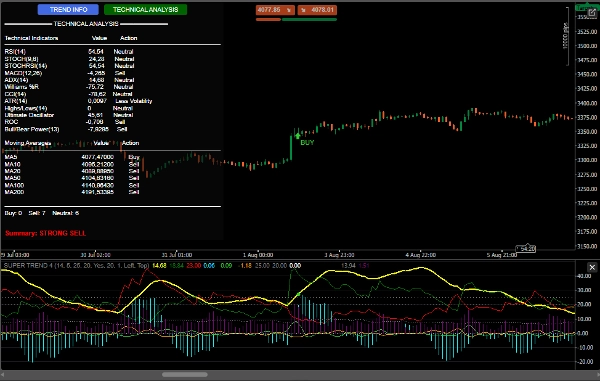
สรุปสุดท้าย: ระบบนับสัญญาณซื้อ/ขาย/เป็นกลางและออกคำแนะนำที่ชัดเจน:
ซื้ออย่างแข็งแกร่ง (≥7 สัญญาณซื้อ)
ซื้อ
ขาย
ขายอย่างแข็งแกร่ง (≥7 สัญญาณขาย)
เป็นกลาง
🔔 การแจ้งเตือนและการแสดงผล
สัญญาณภาพบนกราฟ:
ลูกศรสีเขียว/แดงพร้อมป้าย "BUY"/"SELL"
การแจ้งเตือนด้วยเสียง (Windows)
บันทึกรายละเอียดในคอนโซลพร้อมด้วย:
เวลาสัญญาณ
ค่า ADX, DI และปริมาณ (ถ้าเปิดใช้งาน)
🛡️ ข้อได้เปรียบในการแข่งขัน
✅ การผสานรวมตัวชี้วัดหลายตัวในแผงเดียว
✅ มุ่งเน้นที่ความแข็งแกร่งและทิศทางของแนวโน้ม (ไม่ใช่แค่ราคา)
✅ ตัวกรองปริมาณเพื่อความน่าเชื่อถือที่สูงขึ้น
✅ อินเทอร์เฟซแบบโต้ตอบและให้ข้อมูล
✅ สัญญาณที่ชัดเจนพร้อมการแจ้งเตือนด้วยภาพและเสียง


!["[Hamster-Coder] Bollinger Bands" โลโก้](https://cdn.ctrader.com/image/webp/21d8e5d6-fb11-4bac-b9ee-cd05c2b76804_30327)