คำอธิบาย
Bounty Killa – ตัวบ่งชี้ที่ล่าของเหลวหยุดขาดทุนก่อนที่ผู้เล่นรายใหญ่จะทำ
Bounty Killa เป็นตัวบ่งชี้ cTrader ที่ออกแบบมาสำหรับเทรดเดอร์ที่ชอบเทรด การล่าหยุด / การจับของเหลว: แท่งเทียนที่พุ่งสูงเหนือจุดสูงสุดหรือ ต่ำกว่าจุดต่ำสุด ล้างหยุด และจากนั้นกลับตัวในทิศทางตรงกันข้าม
ตัวบ่งชี้จะสแกนแท่งเทียนทุกแท่งโดยอัตโนมัติและทำเครื่องหมาย:
- SHS (Stop Hunt High) – การล่าหยุดที่เป็นไปได้เหนือจุดสูงสุดล่าสุด → พื้นที่สำหรับมองหา การตั้งค่าสั้น
- SHL (Stop Hunt Low) – การล่าหยุดที่เป็นไปได้ต่ำกว่าจุดต่ำสุดล่าสุด → พื้นที่สำหรับมองหา การตั้งค่าที่ยาว
ตรรกะการตรวจจับถูกสร้างขึ้นจาก:
- การทำลายจุดสูงสุด/ต่ำสุดล่าสุดอย่างน้อย X pips,
- ไส้เทียนยาว ที่ยื่นเกินระดับนั้น,
- ตัวแท่งเทียนขนาดเล็ก และปิดในทิศทางตรงกันข้ามของการเบรคเอาท์
ไม่ต้องเดาอีกต่อไปว่า “อาจจะเป็นการล่าหยุด”: Bounty Killer เน้นแท่งเทียนสำคัญโดยตรงบนแผนภูมิของคุณ พร้อมป้ายชื่อ สี และคำอธิบายบนแผนภูมิอย่างชัดเจน
ทำไมเทรดเดอร์ถึงชอบมัน:
- แสดงจุดที่ตลาดอาจ จับของเหลว และที่ที่การกลับตัวมีความหมายมากขึ้น
- ปรับแต่งได้อย่าง เต็มที่: หน้าต่างย้อนกลับ, การเบรคเอาท์ขั้นต่ำเป็น pips, เปอร์เซ็นต์ตัวแท่งเทียน/ไส้เทียน, การเลื่อนสัญญาณ
- ผสมผสานได้อย่างลงตัวกับ แนวรับ/แนวต้าน แบบคลาสสิก, อุปสงค์และอุปทาน, ปริมาณ, บล็อกคำสั่ง และแนวคิด SMC
- เหมาะสำหรับเทรดเดอร์ที่ติดตาม การตั้งค่าที่อิงของเหลว แต่ต้องการสิ่งที่ เป็นวัตถุประสงค์และมีพื้นฐานตามกฎ แทนการเดาแบบลอยๆ
⚠️ Bounty Killa ไม่ใช่ ระบบการเทรดเต็มรูปแบบและไม่เปิดหรือปิดการเทรดใดๆ
แท่งเทียนที่ทำเครื่องหมายเป็นโซนข้อมูลสูงที่ควรรวมเข้ากับกลยุทธ์ของคุณเอง การวิเคราะห์แนวโน้ม และการจัดการความเสี่ยง
Bounty Killa – คู่มือผู้ใช้ด่วน (EN)
1. ตลาดและกรอบเวลาที่แนะนำ
- กรอบเวลา: H1, H4, D1
(กรอบเวลาต่ำกว่าเช่น M1–M5 = มีเสียงรบกวนมาก ใช้สำหรับศึกษาเป็นหลัก) - สัญลักษณ์: ดัชนี, FX, สกุลเงินดิจิทัล, หุ้น, สินค้าโภคภัณฑ์ – ที่ใดก็ตามที่คุณสามารถแนบตัวบ่งชี้ cTrader ได้
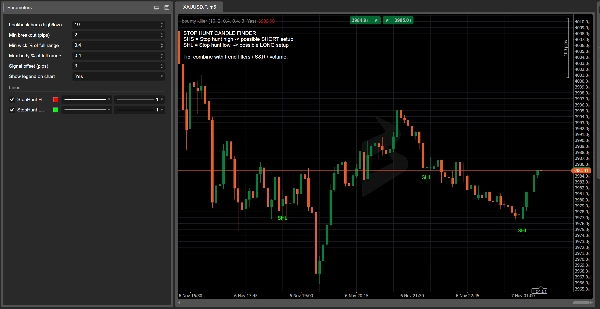
2. วิธีอ่านสัญญาณ
- SHS – Stop Hunt High (ป้ายสีแดงเหนือแท่งเทียน)
-
- ราคาพุ่ง เหนือจุดสูงสุดล่าสุด สร้าง ไส้เทียนยาวด้านบน และ ปิดแบบหมี.
- แนวคิด: การตั้งค่า สั้นที่เป็นไปได้ หลังจากการเบรคเอาท์ปลอมและการจับของเหลวเหนือจุดสูงสุด
- SHL – Stop Hunt Low (ป้ายสีเขียวใต้แท่งเทียน)
-
- ราคาพุ่ง ต่ำกว่าจุดต่ำสุดล่าสุด สร้าง ไส้เทียนยาวด้านล่าง และ ปิดแบบกระทิง.
- แนวคิด: การตั้งค่า ยาวที่เป็นไปได้ หลังจากการเบรคดาวน์ปลอมและการจับของเหลวต่ำกว่าจุดต่ำสุด
Bounty Killer ไม่ บอกว่า “ซื้อ/ขายตอนนี้”
มันเน้น โซนของเหลว ที่การกลับตัวมีความสมเหตุสมผลมากขึ้น
3. การตั้งค่าพื้นฐานที่แนะนำ
ในพารามิเตอร์ของตัวบ่งชี้:
- แท่งย้อนหลัง (สูง/ต่ำ):
10–20
→ จำนวนแท่งที่ย้อนกลับไปดูจุดสูงสุด/ต่ำสุดล่าสุด - เบรคเอาท์ขั้นต่ำ (pips):
5–15pips
→ ระยะทางขั้นต่ำที่เกินจุดสูงสุด/ต่ำสุดเพื่อถือเป็นการล่าหยุด - เปอร์เซ็นต์ไส้เทียนของช่วงเต็ม:
0.60–0.70
→ อย่างน้อย 60–70% ของแท่งเทียนต้องเป็นไส้เทียนในทิศทางการล่าหยุด - เปอร์เซ็นต์ตัวแท่งเทียนของช่วงเต็มสูงสุด:
0.25–0.35
→ ตัวแท่งเทียนขนาดเล็กเมื่อเทียบกับช่วงแท่งเทียนทั้งหมด - การเลื่อนสัญญาณ (pips):
3–5
→ สำหรับการแสดงผลเท่านั้น เลื่อนป้าย SHS/SHL ออกเล็กน้อยจากแท่งเทียน
4. ตัวอย่างกลยุทธ์ง่ายๆ
ตัวกรองแนวโน้ม (EMA 200):
- เพิ่ม EMA 200 ลงในแผนภูมิของคุณ
- เทรดสั้นเท่านั้น:
-
- ราคา ต่ำกว่า EMA 200
- คุณจะได้รับสัญญาณ SHS (การล่าหยุดสูง)
- เทรดยาวเท่านั้น:
-
- ราคา สูงกว่า EMA 200
- คุณจะได้รับสัญญาณ SHL (การล่าหยุดต่ำ)
แนวคิดการเข้าเทรด:
- รอให้ แท่งเทียนล่าหยุดปิด.
- เข้าเทรดในแท่งถัดไป เฉพาะเมื่อราคายืนยัน:
-
- สำหรับ SHS: แท่งถัดไปทำลาย ต่ำ ของแท่ง SHS → พิจารณาเทรดสั้น
- สำหรับ SHL: แท่งถัดไปทำลาย สูง ของแท่ง SHL → พิจารณาเทรดยาว
จุดหยุดขาดทุน:
- สำหรับ SHS (เทรดสั้น) → SL เพียงแค่ เหนือจุดสูงสุด ของแท่ง SHS
- สำหรับ SHL (เทรดยาว) → SL เพียงแค่ ต่ำกว่าจุดต่ำสุด ของแท่ง SHL
ทำกำไร:
- ตั้งเป้าอย่างน้อย 1:1.5 หรือ 1:2 R/R หรือ
- ใช้จุดสูงสุด/ต่ำสุดสวิงใกล้เคียง แนวรับ/แนวต้าน หรือโซนอุปสงค์/อุปทานเป็นเป้าหมาย
5. หมายเหตุความปลอดภัย & รายการตรวจสอบด่วน
ก่อนใช้สัญญาณ Bounty Killer ให้ถามตัวเองว่า:
- แนวโน้ม?
สัญญาณสอดคล้องกับแนวโน้มโดยรวม (EMA 200 / โครงสร้างตลาด) หรือไม่? - ระดับ?
การล่าหยุดเกิดขึ้นที่ระดับที่มีความหมาย (จุดสูงสุด/ต่ำสุดก่อนหน้า, แนวรับ/แนวต้าน, จุดสูงสุด/ต่ำสุดของเซสชัน ฯลฯ) หรือไม่? - บริบท?
มีข่าวสาร, การเปิด/ปิดเซสชัน, การพุ่งขึ้นของความผันผวนหรือไม่? - ความเสี่ยง?
ขนาดหยุดของคุณเหมาะสมกับการจัดการเงินของคุณหรือไม่ (เปอร์เซ็นต์สูงสุดต่อการเทรด)?
ถ้าจุด 3–4 ข้อนี้ตรงกัน สัญญาณ SHS/SHL จาก Bounty Killa ไม่ใช่แค่ “แท่งเทียนสวยๆ” แต่เป็น โซนคุณค่าสูง ที่ควรสร้างไอเดียเทรดรอบๆ
สรุป
The detection criteria include a breakout beyond recent highs/lows by a configurable number of pips, a long wick extending beyond that level, a small candle body, and a close opposite to the breakout direction. Signals are displayed directly on the chart with clear labels and colors, supported by an on-chart legend.
Recommended for use on hourly to daily timeframes (H1, H4, D1) across various markets including forex, indices, cryptocurrencies, stocks, and commodities, Bounty Killa is fully customizable with parameters such as lookback period, minimum breakout size, wick and body proportions, and signal label offset.
The indicator highlights high-value liquidity zones to support trading decisions but does not execute trades. It is intended to be combined with other analysis tools like support/resistance, volume, order blocks, and trend filters (e.g., 200 EMA) for developing objective, rule-based liquidity-based trading setups.
รีวิวจากลูกค้า
5 | 50 % | |
4 | 50 % | |
3 | 0 % | |
2 | 0 % | |
1 | 0 % |


