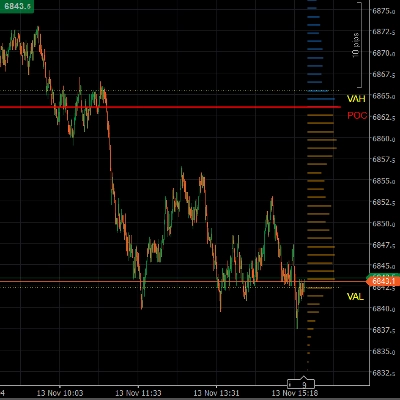
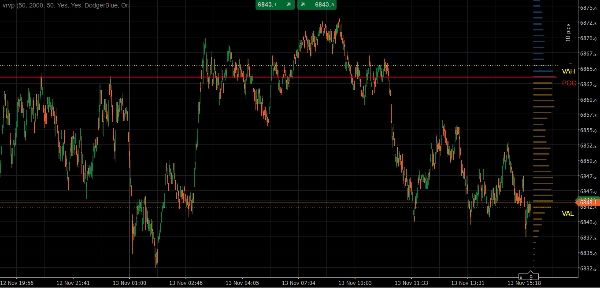
โบรกเกอร์และ Props
สำหรับธุรกิจ
00
Days
:
00
Hours
:
00
Minutes
:
00
Seconds
อินดิเคเตอร์
Grid
NAS100
RSI
NZDUSD
Breakout
XAUUSD
FVG
Martingale
Fibonacci
Signal
EURUSD
MACD
Bollinger
GBPUSD
BTCUSD
AI
SMC
VWAP
ZigZag
ATR
Supertrend
USDJPY
Scalping
vrvp
21/12/2025
Desktop
ตั้งแต่ 12/03/2025
การขาย
14
ติดตั้งฟรี
29
"vrvp" ภาพที่อัปโหลด

✅ Identifies high-volume zones where real market interest is located
✅ Displays POC, Value Area High & Value Area Low at a glance
✅ Pinpoints institutional support & resistance with precision
✅ Helps define high-probability entries, targets, and stops
✅ Perfect for scalping, day trading, and swing trading

The VRVP (Visible Range Volume Profile) indicator reveals where the market truly trades, not just where price moves.
By visualizing volume distribution, it exposes the levels institutions care about most.
High-volume nodes act as price magnets, while low-volume areas often lead to fast, impulsive moves.
With clear POC and value-area levels, you gain objective market structure instead of guesswork.
VRVP adds powerful context to price action, liquidity, and trend analysis.
Whether you trade intraday or swing setups, this tool delivers clarity, precision, and confidence.
Stop chasing price — start trading where volume dominates.

0.0
รีวิว: 0
รีวิวจากลูกค้า
ยังไม่มีรีวิวสำหรับผลิตภัณฑ์นี้ หากเคยลองแล้ว ขอเชิญมาเป็นคนแรกที่บอกคนอื่น!
เพิ่มเติมจากผู้เขียนคนนี้
Know sure thing
Know Sure Thing (KST) momentum engine
Buy and sell indicator
Buy and Sell Signals
อินดิเคเตอร์
Grid
Breakout
Martingale
+4
Coloring Trendline with arrows
Coloring trendline/ Colored Trendline / Color Trendline
ยอดนิยม
$ 29
อินดิเคเตอร์
NAS100
NZDUSD
Martingale
+26
overbought oversold
Overbought Oversold Indicator
อินดิเคเตอร์
NAS100
NZDUSD
Martingale
+25
Aggressive Entry Momentum MACD Power Guide
Entry Momentum MACD Power Guide
อินดิเคเตอร์
NAS100
NZDUSD
Martingale
+26
The Professional “All-in-One” Trading Suite
The Professional “All-in-One” Trading Suite (buy and sell indicator)
heatmap kopie
Dynamic Liquidity Depth exposes hidden volume
crossover 1
Crossover Buy and Sell Alerts and signals
อินดิเคเตอร์
NAS100
NZDUSD
Martingale
+26
Colored Power MACD MA line
Ultra-clean precision MACD momentum logic
อินดิเคเตอร์
NAS100
NZDUSD
Martingale
+26
z-score colored
The Rolling Z-Score Trend
นอกจากนี้คุณยังอาจชอบ
LIQUIDITY POOLS SIGNAL FREE
INDICATOR,LIQUIDITY POOLS,ACCURATE SIGNAL, NO DELAY,80% PROBABILITY
SMCTimingIndicator
Customizable cTrader indicator for marking trading sessions with vertical lines.
AsiaSession
Visualize Asia session range with customizable lines for high, low, mid, start, and end.
MTF Candle Window - On Chart
The Multi-Timeframe Candle Indicator displays candles from multiple timeframes in one window, enhancing market analysis!
Vsamarth Indi
One‑click RSI robot for consistent rapid‑fire trades.
SMC + FVG Binary Signal Pro
SMC/ICT signals using FVG + liquidity sweep/MSS with EMA-RSI-MACD filters, clear visuals, and actionable alerts.
Fibonacci Prediction Channel
Designed to plot a future prediction channel based on Fibonacci retracement levels 📊
ScalpingSignalIndicator
Scalping signals with EMA/RSI/ATR logic. Visual cloud shows precise entry and exit zones. Built for M1/M5 scalpers.
Automatic Fibonatti
Automatically plots Fibonacci retracement levels using the highest and lowest points of a customizable time range
ยอดนิยม
$ 15
/
$30
SmartFibonacci
SmartFibonacci — automatic Fibonacci retracements & extensions with swing detection, alerts and clean labels for cTrader
mIntrinsicRecursiveValue
Intrinsic Recursive Value Indicator
Fibonacci Pitchfan
Powerful all-in-one tool for traders seeking a clear, dynamic view of market structure. By merging pivots, trendlines &
QQEX 2026 ULTRA
🚀 QQEX Trinity Indicator - The Ultimate Trading Filter 🚀
Previous Day Equilibrium (Premium & Discount)
Plots the equilibrium price levels based on previous daily highs and lows.
ยอดนิยม
$ 15
/
$20
ProVWAP
Advanced Anchored VWAP for cTrader: volatility bands, real‑time alerts & customizable session resets.
Dynamic Range MomentumI
This histogram helps visualize the strength and direction of market movements, making it easier to spot potential trends
rolling stdv
Multi-Timeframe Rolling Volatility Indicator - Smart Volatility Breakout System