present
ลงทะเบียนและรับส่วนลด $50 สำหรับการซื้อครั้งแรกของคุณ
Trading product for Kalman Filter Trend อินดิเคเตอร์ Signal Indices, image 1
Kalman Filter Trend
อินดิเคเตอร์
เวอร์ชัน 1.0, Nov 2025
Windows, Mac
4.5
รีวิว: 4
Trading product for Kalman Filter Trend อินดิเคเตอร์ Signal Indices, image 2
42.11M
ปริมาณการเทรด
6.13M
Pips ที่ได้กำไร
251
การขาย
9.46K
ติดตั้งฟรี

คำอธิบาย

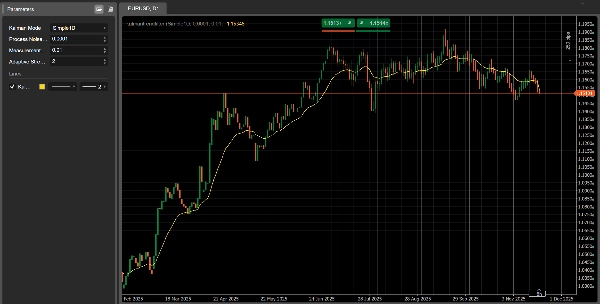
📌 แนวโน้มตัวกรอง Kalman – ภาพรวม & รีวิว

แนวโน้มตัวกรอง Kalman เป็นตัวบ่งชี้ติดตามแนวโน้มขั้นสูงสำหรับ cTrader ออกแบบมาเพื่อให้ได้ เส้นแนวโน้มที่เรียบและตอบสนองสูง โดยมีความหน่วงน้อยกว่าค่าเฉลี่ยเคลื่อนที่แบบดั้งเดิมอย่างมาก

ในขณะที่ตัวกรอง SMA/EMA แบบคลาสสิกตอบสนองช้าและมักพลาดการเปลี่ยนแปลงแนวโน้มในช่วงต้น ตัวกรอง Kalman:

  • อัปเดตการประมาณราคาที่ “แท้จริง” อย่างต่อเนื่อง
  • ปรับสมดุลความเรียบและการตอบสนองทางคณิตศาสตร์
  • ปรับตัวตามความผันผวน (โหมด Adaptive)
  • จำลองทั้ง ราคาและความเร็ว (โหมด 2D)

สิ่งนี้ทำให้เป็นเครื่องมือที่ทรงพลังสำหรับทั้งผู้ซื้อขายด้วยตนเองและนักพัฒนาระบบอัตโนมัติ


🎛 โหมด & พารามิเตอร์

โหมด Kalman (3 เวอร์ชันในตัวบ่งชี้เดียว)

1️⃣ Simple1D

ตัวกรอง Kalman 1D แบบคลาสสิก
รวดเร็ว สะอาด และยอดเยี่ยมสำหรับการตรวจจับแนวโน้มระยะสั้น

2️⃣ PositionVelocity2D

จำลองทั้งราคาและความเร็วแนวโน้ม
เหมาะสำหรับเป็น ตัวกรองทิศทาง ในกลยุทธ์อัลกอริทึม

3️⃣ Adaptive1D

ปรับตัวโดยอัตโนมัติตามความผันผวน
ตอบสนองมากขึ้นในตลาดที่รวดเร็ว เรียบเนียนขึ้นในสภาวะเงียบสงบ


🧩 อธิบายพารามิเตอร์หลัก

  • สัญญาณรบกวนกระบวนการ (Q):
    สูง = การตอบสนองแนวโน้มเร็วขึ้น ต่ำ = เส้นเรียบขึ้น
  • สัญญาณรบกวนการวัด (R):
    สูง = ตัวกรองไว้วางใจข้อมูลน้อยลง → ผลลัพธ์เรียบขึ้น
  • ความแข็งแรงแบบปรับตัว:
    ใช้เฉพาะใน Adaptive1D ควบคุมว่าความผันผวนมีผลต่อตัวกรองมากน้อยเพียงใด


📈 วิธีตีความสัญญาณ

1. การตรวจจับทิศทางแนวโน้ม

  • แนวโน้มขาขึ้น: เส้นลาดขึ้น ราคาอยู่เหนือฟิลเตอร์
  • แนวโน้มขาลง: เส้นลาดลง ราคาอยู่ต่ำกว่าฟิลเตอร์
  • แนวโน้มด้านข้าง: ตลาดอยู่ในช่วงขอบเขต หลีกเลี่ยงกลยุทธ์เบรกเอาต์


2. สัญญาณเข้า (ตรรกะการตัดกัน)

สัญญาณเข้าซื้อ (Bullish Entry):

  • ราคาปิด เหนือ เส้น Kalman
  • เส้นเริ่มหัน ขึ้น

สัญญาณเข้าขาย (Bearish Entry):

  • ราคาปิด ต่ำกว่า เส้น Kalman
  • เส้นเริ่มหัน ลง


3. ความแข็งแรงของแนวโน้ม (โหมด 2D)

ความลาดชันกลายเป็นการอ่านโดยตรงของโมเมนตัม:

  • ความลาดชันขึ้นมาก → แนวโน้มขาขึ้นแข็งแกร่ง
  • ความลาดชันลงมาก → แนวโน้มขาลงแข็งแกร่ง
  • ความลาดชันแบน → แนวโน้มอ่อนตัวหรือช่วงเปลี่ยนผ่าน


📊 ตัวอย่างการใช้งานจริง

✔ กลยุทธ์ติดตามแนวโน้ม

ใช้ Simple1D หรือ Adaptive1D:

  • ซื้อเหนือเส้นเมื่อความลาดชันเป็นบวก
  • ขายต่ำกว่าเส้นเมื่อความลาดชันเป็นลบ

✔ แนวทางหลายกรอบเวลา

  • ใช้ Kalman บน H1 เพื่อกำหนดทิศทาง
  • ใช้ Kalman บน M15 สำหรับการเข้าอย่างแม่นยำ
  • เข้าเทรดเฉพาะในทิศทางที่กรอบเวลาสูงกว่าชี้นำ

✔ การรวมบอท

เหมาะสำหรับการซื้อขายด้วยอัลกอริทึม:

  • อนุญาต เฉพาะการซื้อ หากความลาดชัน > 0
  • อนุญาต เฉพาะการขาย หากความลาดชัน < 0
  • ใช้ Adaptive1D สำหรับดัชนีที่ผันผวนเช่น US500, NAS100, US2000


🌟 เข้าร่วมชุมชนของเรา

หากคุณต้องการเข้าถึง:

  • การปรับแต่งพิเศษสำหรับบอทแต่ละตัวของเรา
  • เคล็ดลับการตั้งค่าขั้นสูง
  • การปรับปรุงการซื้อขาย
  • ความช่วยเหลือทางเทคนิคแบบส่วนตัว
  • การอัปเดตและเครื่องมือใหม่ๆ

👉 เข้าร่วมชุมชนของเราโดยคลิกที่ลิงก์ในหน้าประวัติของฉัน
ที่นั่นคุณจะพบ การตั้งค่าการปรับแต่งที่ดีที่สุดสำหรับบอททั้งหมดของเรา ที่อัปเดตอย่างสม่ำเสมอ

สรุป

สรุปโดย AI
Kalman Filter Trend is an advanced trend-following indicator for cTrader that provides a smooth and highly responsive trend line with minimal lag compared to traditional moving averages. It continuously updates its estimate of the true price by mathematically balancing smoothness and responsiveness, adapting to market volatility in its Adaptive mode, and modeling both price and velocity in its 2D mode.

The indicator offers three modes: Simple1D for fast, short-term trend detection; PositionVelocity2D for modeling price and trend velocity, suitable as a directional filter in algorithmic strategies; and Adaptive1D, which adjusts automatically to volatility for smoother or more reactive behavior depending on market conditions.

Key parameters include Process Noise (Q) controlling trend reaction speed versus smoothness, Measurement Noise (R) affecting data trust and smoothing, and Adaptive Strength for volatility sensitivity in Adaptive1D mode.

Users interpret the indicator by trend direction (uptrend, downtrend, flat), entry signals based on price crossing and slope changes, and trend strength via slope magnitude in 2D mode. It supports various practical uses such as trend-follow strategies, multi-timeframe analysis, and integration into automated trading systems, particularly for indices and volatile markets.
โปรไฟล์อินดิเคเตอร์

รีวิวจากลูกค้า

4.5
รีวิว: 4
5
50 %
4
50 %
3
0 %
2
0 %
1
0 %
รีวิวจากลูกค้า
December 5, 2025
November 30, 2025
Good enough to keep watching for another week. 3 sessions is a fair first sample.
November 27, 2025
a small account test feels safer, and the setup needs a cleaner reason to exist.
November 22, 2025

การสนทนา

คำถามที่พบบ่อย

Signal
Indices
Commodities
GBPUSD
RSI
Bollinger
Fibonacci
Scalping
AI
XAUUSD
NAS100
MACD
BTCUSD
Forex
Breakout
EURUSD
NZDUSD
Martingale
Prop
ZigZag
Supertrend
Fair Value Gap
SMC
Crypto
Grid
Stocks
ATR
USDJPY
VWAP
ผลิตภัณฑ์ที่มีให้บริการผ่าน cTrader Store รวมถึงบอทการเทรด อินดิเคเตอร์ และปลั๊กอิน มีให้บริการโดยนักพัฒนาบุคคลที่สามและมีไว้เพื่อวัตถุประสงค์ในการเข้าถึงข้อมูลและทางเทคนิคเท่านั้น cTrader Store ไม่ใช่โบรกเกอร์และไม่ได้ให้คำแนะนำการลงทุน คำแนะนำส่วนบุคคล หรือการรับประกันผลการดำเนินงานในอนาคต

เพิ่มเติมจากผู้เขียนคนนี้

อินดิเคเตอร์
AI
Grid
+17
Editions: Free (core VWAP + bands) · Pro (multi‑VWAP, click‑to‑anchor, alerts).
"Prop Ready Bot_v.2.0" โลโก้
ยอดนิยม
4.2
(5)
$39
/
$49
cBot
AI
ATR
+27
The Prop-Ready Bot The Definitive Automaton for Challenges 🛡️ V2.0
อินดิเคเตอร์
AI
ATR
+27
Read aggressive flow in real time. Flexible resets (Day/Week/Month), optional EMA smoothing, and non-repainting cumulati
"True Scalper Ai v4.0" โลโก้
ยอดนิยม
5.0
(4)
$119
/
$238
cBot
ATR
RSI
+23
TrueScalper AI PRO v4.0 turns live market structure into disciplined AI-filtered scalping execution.
20%
ROI
5
อัตราส่วน กำไรต่อขาดทุน
อินดิเคเตอร์
AI
ATR
+27
Volume Bubbles is a lightweight yet powerful visual indicator for cTrader
"Breakout Premium Pro v2.0" โลโก้
ยอดนิยม
4.3
(3)
$49
/
$97
cBot
AI
ATR
+21
A price-action-first algorithm to trade Breakout, Approach, and Return around prior High/Low levels—with Prop-style risk
cBot
AI
ATR
+27
N.B.: Results with an initial invested capital of 100 euros.
"TradeCopierBot" โลโก้
ยอดนิยม
4.3
(3)
$69
/
$119
cBot
AI
ATR
+27
✅ Buy 3 prop accounts and manage just 1: cut management effort by 66% with a professional tool.
อินดิเคเตอร์
AI
ATR
+27
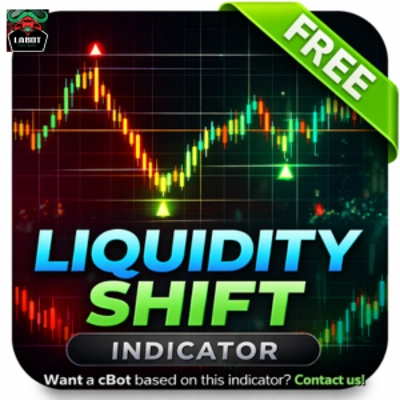
Want a cBot based on this indicator? Contact us!
"AI Level Trader" โลโก้
ยอดนิยม
4.2
(4)
$129
/
$159
cBot
AI
ATR
+27
AILevelTrader — Multi-AI Consensus Trading Bot 11 AI providers. One consensus. Prop Firm Ready.
1.9
อัตราส่วน กำไรต่อขาดทุน
อินดิเคเตอร์
Prop
Forex
+15
ZigZag Free is a clean swing-detection tool that marks significant pivot highs/lows
"Prop Scalper Gold" โลโก้
ยอดนิยม
5.0
(3)
$79
/
$89
cBot
AI
Prop
+5
Premium algorithmic scalping for funded traders. Capture precise breakouts with ironclad risk management across all majo
14%
ROI
4
อัตราส่วน กำไรต่อขาดทุน

นอกจากนี้คุณยังอาจชอบ

อินดิเคเตอร์
BOS
MSS
+5
One indicator, full ICT/SMC picture — structure, OBs, FVGs, liquidity, Premium/Discount — with graded PRIME/SETUP signal
อินดิเคเตอร์
BOS
MSS
+5
WinSMC is an overlay SMC indicator for cTrader. It helps you visually identify!
"UT Bot Alerts Nova" โลโก้
ยอดนิยม
4.8
(6)
$19
อินดิเคเตอร์
ATR
Forex
+6
UT Bot Alerts Nova: Advanced trend-following indicator using ATR for signals. Precise entries/exits.
อินดิเคเตอร์
Forex
BTCUSD
+4
This indicator is designed to perform multiple non-linear regression analysis using four independent variables.
อินดิเคเตอร์
ATR
Prop
+13
Enhance trading with ATR Bands! Visualize market volatility using dynamic upper and lower ATR bands for precise decision
อินดิเคเตอร์
Drawdown Monitor
Proprietary trading desk risk monitoring dashboard!
อินดิเคเตอร์
cTreder Smart SMA
อินดิเคเตอร์
Engulfing
Fibonacci
+4
Six higher-timeframe candle sets on one chart, with liquidity sweep detection and swept levels.
อินดิเคเตอร์
Visually master the Inside Bar strategy with clear breakout signals and professional chart highlighting 📈🔔📉
อินดิเคเตอร์
ATR
Volume
+5
Order blocks with measured hold-rate stats and confidence scoring — not just zones on a chart.
อินดิเคเตอร์
Forex
GBPUSD
+3
Support & resistance zones with measured hold rates and confidence intervals — evidence, not just lines on a chart.
อินดิเคเตอร์
BOS
Volume
+5
20/40/60-day IPDA lookback ranges, Premium/Discount/Equilibrium zones, and quarterly shift alerts — anchored to true dai
อินดิเคเตอร์
Advanced price action tool that combines multiple technical analysis concepts
"Stochastic RSI PRO" โลโก้
เรตติ้งสูง
4.6
(6)
$28
/
$40
อินดิเคเตอร์
RSI
Prop
+14
Unlock Stochastic RSI PRO in cTrader! Overlay RSI, highlight zones, and identify divergences with customizable settings.
อินดิเคเตอร์
AI
Prop
+7
EMA Clouds, Multi-Timeframe (MTF) Overlay, Swing High/Low detection, and a smart Dashboard with neutral zone filtering.
"BubbleXRay" โลโก้
ยอดนิยม
4.3
(3)
$19
/
$29
อินดิเคเตอร์
Volume
Imbalance
+5
Spot Institutional Order Flow with Proportional Volume Bubbles & Integrated Cumulative Volume Delta (CVD) Intelligence.
อินดิเคเตอร์
ATR
MSS
+5
Grades ICT Unicorn setups (Breaker Block + FVG confluence) into PRIME / SETUP / WATCH, with retest & RR targets.
อินดิเคเตอร์
AI
ATR
+27
Deep Mood Distribution (DMD) is a segmented volume-profile and sentiment tool that analyzes price action in fixed bar bl

ราคา

42.11M
ปริมาณการเทรด
6.13M
Pips ที่ได้กำไร
251
การขาย
9.46K
ติดตั้งฟรี