
Volume Spike Candle Tracker
Indicator
Version 1.0, Oct 2026
Windows, Mac

Since 04/06/2025
Description
Product Overview
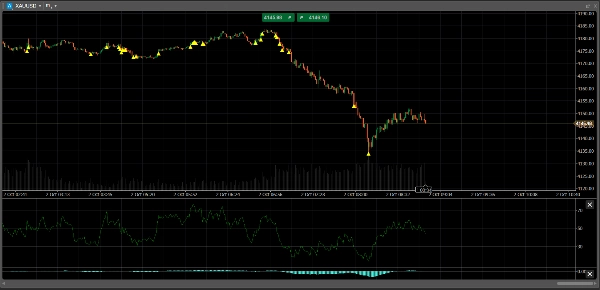
The Volume Spike Candle Tracker is a professional-grade cTrader indicator designed to detect institutional 'Smart Money' activity, high-liquidity breakouts, and market exhaustion points. By evaluating real-time Tick Volume against a customizable Moving Average, this tool isolates market noise and visually highlights exactly where the heavy buying or selling pressure enters the market.
Key Features & Visual Signals
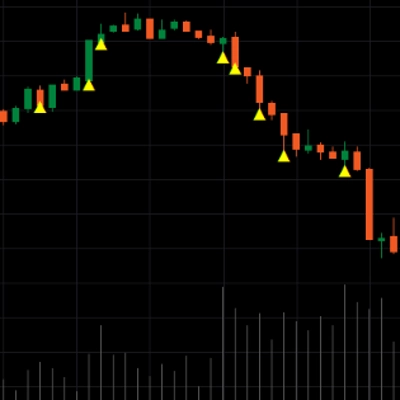
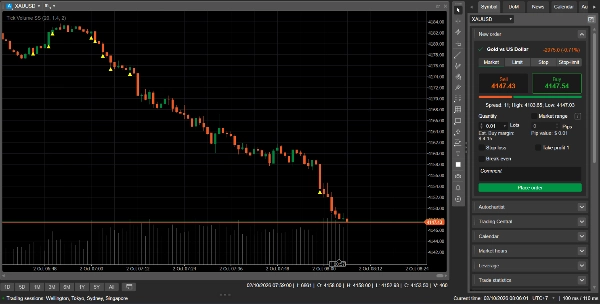
- Clutter-Free Signals: Instead of changing candle colors or cluttering the lower window, it plots a sharp, perfectly centered Yellow Triangle (▲) underneath the candle's wick.
- Precision Placement: The indicator automatically offsets the signal below the candle's low price, ensuring your price action and candlestick bodies remain 100% visible.
Parameters & Customization
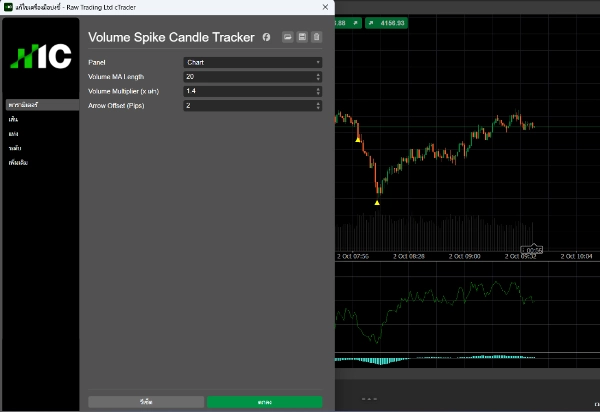
- Volume MA Length (Default: 20): Adjusts the period used to calculate the average baseline volume.
- Volume Multiplier (Default: 1.4x): Defines how many times the current volume must exceed the baseline average to trigger the signal.
- Arrow Offset (Pips) (Default: 2.0): Allows users to fine-tune the vertical gap between the triangle signal and the bottom of the candlestick wick.
Best Use Cases
- Breakout Confirmation: Validates key support/resistance breaks. A breakout accompanied by a yellow triangle confirms strong institutional backing, reducing the risk of fakeouts.
- Trend Reversal Warning: Volume surges at the end of extended trends often indicate exhaustion, giving traders early warning signs to lock in profits or prepare for counter-trend setups.
Who is it for?
This tool is perfect for price action traders, breakout traders, and scalpers across all timeframes who want to integrate volume analysis into their strategy without messing up their chart template.
Summary
AI summary
The Volume Spike Candle Tracker is a cTrader indicator designed to identify institutional trading activity by detecting significant volume spikes relative to a customizable moving average baseline. It analyzes real-time tick volume to filter out market noise and highlights candles with high liquidity using a distinct yellow triangle placed precisely below the candle’s wick, preserving chart clarity and price action visibility. Key adjustable parameters include the volume moving average length, volume multiplier threshold for signal activation, and vertical offset of the triangle indicator. This tool is suited for price action traders, breakout traders, and scalpers across all timeframes. It assists in confirming breakouts with institutional backing and provides early warnings of trend exhaustion, helping traders validate support/resistance breaks and anticipate potential reversals without cluttering their charts.
Indicator profile
Indicator category
Volume
Output type
Visualisation
Data requirements
Tick data
Supported signals
Breakout
Reversal
Divergence
Discussion
Customer reviews
0.0
Reviews: 0
Customer reviews
No reviews for this product yet. Already tried it? Be the first to tell others!
FAQ
Double Top
Fair Value Gap
Volume
Doji
Triangle
Moving Average
Support & Resistance
Products available through cTrader Store, including trading bots, indicators and plugins, are provided by third-party developers and made available for informational and technical access purposes only. cTrader Store is not a broker and does not provide investment advice, personal recommendations or any guarantee of future performance.






Price
Since 04/06/2025