OR Session Zones
อินดิเคเตอร์
เวอร์ชัน 1.1, Dec 2025
Windows, Mac
4.5
รีวิว: 2
คำอธิบาย
โซนเซสชัน OR — ตัวบ่งชี้ช่วงเปิดหลายเซสชัน
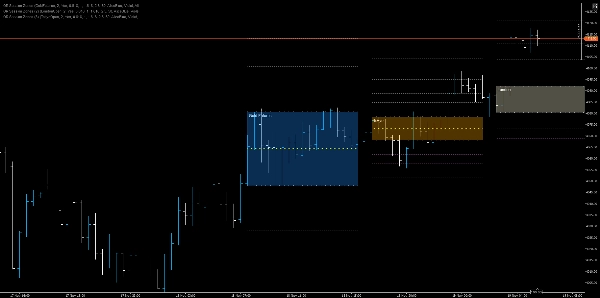
ตัวบ่งชี้ช่วงเปิดที่มีความแม่นยำสูงซึ่งตรวจจับการเปิดเซสชัน (NY, London, EU, Tokyo, Shanghai, สัญญาซื้อขายล่วงหน้าทองคำ/น้ำมันดิบ) วาดโซนสูง/ต่ำ/กลาง OR แบบไดนามิก ทำนายเป้าหมายตามฟีโบนักชี และระบายพื้นที่ที่ปรับแต่งได้เพื่อการตัดสินใจด้วยสายตาอย่างรวดเร็ว
คุณสมบัติหลัก
- การตรวจจับหลายเซสชัน: รองรับโดยเนทีฟสำหรับแท่งเปิดของ New York, London, EuroNext, Tokyo, Shanghai, สัญญาซื้อขายล่วงหน้าทองคำ และสัญญาซื้อขายล่วงหน้าน้ำมันดิบโดยใช้ตัวบ่งชี้เซสชันเฉพาะ
- การคำนวณช่วงเปิด: คำนวณ OR สูงและ OR ต่ำจากจำนวนแท่งเทียนที่ปรับแต่งได้ (RangeCandles) และบันทึกเวลาที่เซสชันเริ่มต้น
- การวางซ้อนแผนภูมิที่คงอยู่: วาดเส้นแนวโน้มสำหรับ OR สูง, OR ต่ำ และ OR กลาง (50%) ทั่วทั้งแผนภูมิจนถึงเวลาขยายที่ปรับแต่งได้
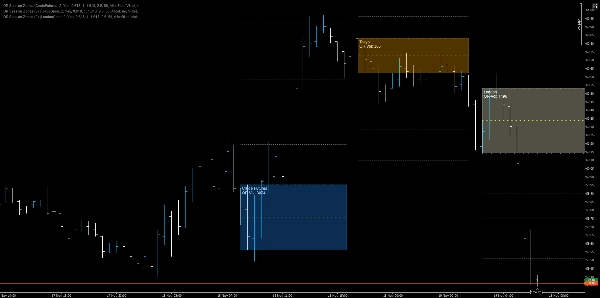
- โซนที่ระบายสี: สี่เหลี่ยมที่เติมเต็มระหว่าง OR สูงและ OR ต่ำพร้อมความทึบและสีที่ปรับแต่งได้ต่อแต่ละเซสชันเพื่อบริบทด้วยสายตาอย่างรวดเร็ว
- การทำนายฟีโบนักชี: สูงสุดสี่เส้นทำนาย R (แนวต้าน) และ S (แนวรับ) ที่ได้จากช่วง OR พร้อมสีอิสระและความทึบที่ปรับได้
- ความยืดหยุ่นในการมองเห็น: ตัวเลือกในการซ่อนหรือแสดง ID วัตถุที่มีดัชนี (เฉพาะ) เพื่อป้องกันการชนกัน; รองรับทั้งวัตถุคงที่เดี่ยวและวัตถุต่อแท่งเมื่อเปิดใช้งาน Hide
- การเข้ารหัสสีเซสชัน: แต่ละเซสชันใช้ชุดสีที่แตกต่างกัน (เช่น DodgerBlue, LightYellow, Orange, OrangeRed) เพื่อให้แหล่งที่มาของเซสชันชัดเจนทันที
วิธีช่วยผู้ค้า
- บริบทที่รวดเร็ว: เห็นทันทีว่าตลาดเปิดที่ใดสำหรับเซสชันหลักและเข้าใจโครงสร้างช่วงต้นโดยไม่ต้องวัดด้วยตนเอง
- ตัวกระตุ้นการตัดสินใจ: ใช้การเบรก OR, การปฏิเสธเส้นกลาง และการทำนายฟีโบนักชีเป็นกฎการเข้า/ออกหรือจุดยึดการวางหยุด
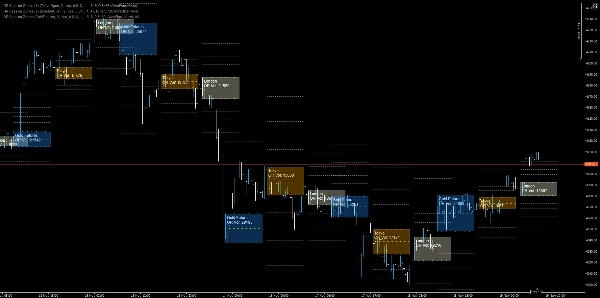
- กลยุทธ์หลายเซสชัน: รวม OR ที่ทับซ้อนกัน (เช่น London + NY) เพื่อค้นหาโซนความสอดคล้องของเซสชันและพื้นที่การเทรดที่มีความน่าจะเป็นสูงขึ้น
- การจัดการความเสี่ยง: วางหยุดหลัง OR สแต็กหรือใช้ 50% กลางเป็นเป้าหมายหยุด/ทำกำไรแบบไดนามิก
สถานการณ์การใช้งานและกฎตัวอย่าง
- การเข้าเบรกเอาท์: ซื้อเมื่อปิดเหนือ OR สูงพร้อมการยืนยันจากปริมาณหรือโมเมนตัม; หยุดต่ำกว่า OR สูงเล็กน้อย (หรือ OR กลางสำหรับการออกที่เข้มงวดกว่า)
- การเล่นสวนเปิด: ขายชอร์ตใกล้ OR สูงพร้อมการยืนยันการกลับตัวหากราคาล้มเหลวในการรักษาตัวเหนือ OR กลางและแสดงการดึงคำสั่งซื้ออย่างรวดเร็ว
- การเทรดโซนความสอดคล้องของเซสชัน: เมื่อ OR ของ London และ NY ทับซ้อนกัน ให้ถือว่าการทับซ้อนเป็นโซนอุปทาน/อุปสงค์ที่มีความมั่นใจสูงและปรับขนาดตำแหน่งตามนั้น
- เป้าหมายการทำนาย: ใช้ R1/R2/R3/R4 เป็นระดับทำกำไรแบบขั้นบันไดและ S1 - S4 อย่างสมมาตรสำหรับเป้าหมายด้านล่าง
สรุป
โปรไฟล์อินดิเคเตอร์
รีวิวจากลูกค้า
4.5
รีวิว: 2
5 | 50 % | |
4 | 50 % | |
3 | 0 % | |
2 | 0 % | |
1 | 0 % |
รีวิวจากลูกค้า
November 22, 2025
Solid enough as a backup opinion, and It can look better than it is during a lucky run.
November 19, 2025
การสนทนา
คำถามที่พบบ่อย
Fibonacci
Forex
Breakout
Indices
EURUSD
Commodities
GBPUSD
XAUUSD
NAS100
ผลิตภัณฑ์ที่มีให้บริการผ่าน cTrader Store รวมถึงบอทการเทรด อินดิเคเตอร์ และปลั๊กอิน มีให้บริการโดยนักพัฒนาบุคคลที่สามและมีไว้เพื่อวัตถุประสงค์ในการเข้าถึงข้อมูลและทางเทคนิคเท่านั้น cTrader Store ไม่ใช่โบรกเกอร์และไม่ได้ให้คำแนะนำการลงทุน คำแนะนำส่วนบุคคล หรือการรับประกันผลการดำเนินงานในอนาคต


ราคา
26
การขาย
2.15K
ติดตั้งฟรี