คำอธิบาย
ระบบตรวจจับ/ทำนายเฟส macd อัจฉริยะ
แนะนำ: Price Distance From EMA — ตัวตรวจจับจุดสูงสุดต่ำสุดของตลาด
ถ้าคุณเคยถูกพลิกกลับตลาดโดยไม่ทันตั้งตัว…
ถ้าคุณเคยไล่ตามการเคลื่อนไหวที่หมดแรงไปแล้ว…
ถ้าคุณเคยหวังว่าจะมีสัญญาณเตือนง่ายๆ ที่มองเห็นได้ว่าราคายืดออกไปไกลเกินไป…
ตัวบ่งชี้นี้คืออาวุธลับใหม่ของคุณ
ตรวจจับตลาดที่ยืดเกินได้ทันที
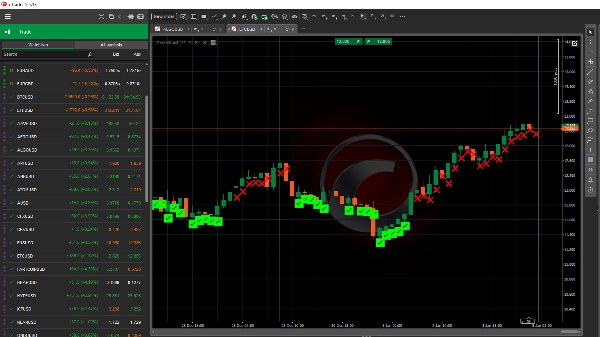
ตัวบ่งชี้ Price Distance From EMA สแกนกราฟ 4H แบบเรียลไทม์และทำเครื่องหมายการเบี่ยงเบนราคาที่สุดขีดจาก EMA 14 ช่วงเวลาด้วยไอคอนที่ชัดเจนและโดดเด่น
❌ สัญญาณเตือนสีแดงเมื่อราคาสูงเกินไปอย่างอันตรายเหนือสมดุล
✅ สัญญาณเตือนสีเขียวเมื่อราคาถูกลดลึกต่ำกว่าสมดุล
ไม่มีการเดา ไม่มีการลังเล ไม่มีความยุ่งเหยิง
แค่สัญญาณที่ชัดเจนและทรงพลังที่บอกคุณอย่างแม่นยำว่าเมื่อใดที่ตลาดยืดเกินสภาพปกติ
ทำไมสิ่งนี้ถึงได้ผล...
สัญญาณเตือนที่ชัดเจนอย่างคริสตัล — คุณจะไม่พลาดจุดสุดขีดอีกต่อไป
ตรรกะแบบพิปสากล — ใช้ได้กับสัญลักษณ์ใดก็ได้ โบรกเกอร์ใดก็ได้
ไม่มีเสียงรบกวน — ทริกเกอร์เฉพาะเมื่อตลาดยืดเกินจริงเท่านั้น
เหมาะสำหรับเทรดเดอร์สวิง, สแคปเปอร์ และระบบอัลกอริทึม
ไอคอนแบบอีโมจิ — รวดเร็ว เข้าใจง่าย และไม่สามารถมองข้ามได้
นี่ไม่ใช่ค่าเฉลี่ยเคลื่อนที่อีกตัวหนึ่ง
นี่คือการตรวจสอบความมีเหตุผลของตลาด — ระบบเตือนแบบเรียลไทม์ที่ช่วยให้คุณหลีกเลี่ยงการเทรดที่ไม่ดีและเข้าเทรดในจุดที่ดีที่สุด
เทรดอย่างชาญฉลาด ไม่ใช่ยากขึ้น
เมื่อราคาห่างจาก EMA มากพอ (โค้ดวัดการเคลื่อนไหว) ตลาดจะถูกยืดออก
นั่นคือจุดที่เกิดการกลับตัว
นั่นคือจุดที่เกิดการล่าหลักทรัพย์
นั่นคือจุดที่เทรดเดอร์ฉลาดวางตำแหน่งตัวเอง — และเทรดเดอร์ที่ใช้อารมณ์จะติดกับดัก
ตัวบ่งชี้นี้ทำให้คุณอยู่ในกลุ่มเทรดเดอร์ฉลาดอย่างแน่นอน
เรียบง่าย งดงาม มีประสิทธิภาพ
แนบมันกับกราฟ 4H ของคุณและปล่อยให้มันคิดแทนคุณ
ไม่มีพารามิเตอร์ให้ปรับแต่งเกินความจำเป็น
ไม่มีความยุ่งเหยิง
แค่ความชัดเจนที่บริสุทธิ์และนำไปใช้ได้จริง
หมายเหตุ
นี่เป็นส่วนหนึ่งของระบบ 3/3 คุณต้องมีครบทั้ง 3 ส่วนเพื่อให้ได้ประสิทธิภาพเต็มที่
ส่วนเพิ่มเติมที่ 4 ก็สามารถซื้อได้เช่นกัน ซึ่งคุณจะได้รับระดับแนวรับและแนวต้านขั้นสูงตามการเคลื่อนไหวของราคา
⭐ ถ้าคุณเทรดโดยไม่มีสิ่งนี้ คุณก็เหมือนเทรดโดยปิดตา
เพิ่มมันลงในกราฟของคุณวันนี้และสัมผัสความแตกต่างของการรู้ว่าตลาดยืดเกินเมื่อใด — ก่อนที่คนอื่นจะเห็น