
คำอธิบาย
UNO KRI เป็นออสซิลเลเตอร์ที่ใช้การเบี่ยงเบนซึ่งมีประสิทธิภาพสูงที่วัดระยะห่างเป็นเปอร์เซ็นต์ระหว่างราคากับค่าเฉลี่ยเคลื่อนที่ที่เลือกไว้ ช่วยให้นักเทรดระบุสภาวะซื้อเกิน 📈 และขายเกิน 🎯 การดึงกลับของแนวโน้ม และการขยายตัวของราคา 🔄 ได้อย่างยืดหยุ่นสูง
แตกต่างจากตัวชี้วัดโมเมนตัมแบบดั้งเดิม KRI UNO มุ่งเน้นเพียงแค่ระยะทางที่ราคาขยายออกจากค่ากลางของมัน ทำให้มีประสิทธิภาพสูงสำหรับกลยุทธ์การกลับสู่ค่าเฉลี่ยและการดึงกลับของแนวโน้มในทุกตลาด
🔢 สูตร
$$KRI = \frac{\text{Price} - \text{Moving Average}}{\text{Moving Average}} \times 100$$
ผลลัพธ์แสดงถึงเปอร์เซ็นต์การเบี่ยงเบนของราคาจาก MA ที่เลือก
🔧 คุณสมบัติ
• รองรับค่าเฉลี่ยเคลื่อนที่ 10 ประเภท: SMA, EMA, WMA, WWMA (Wilder), VIDYA (ปรับตัว), ZLEMA (ไม่มีความหน่วง), TSF (การพยากรณ์เชิงเส้น), HMA (Hull), VWMA (ถ่วงน้ำหนักด้วยปริมาณ), TMA (สามเหลี่ยม)
• กำหนดช่วงเวลา MA ได้เอง & ปรับระดับซื้อเกิน/ขายเกินได้
• ใช้งานได้กับแหล่งราคาทุกประเภท (ปิด, เปิด, สูง, ต่ำ ฯลฯ)
• มีเส้นศูนย์ที่ชัดเจนสำหรับอ้างอิงแนวโน้ม
📈 วิธีการทำงาน
• สูงกว่า 0 → ราคาซื้อขายสูงกว่า MA (แนวโน้มขาขึ้น)
• ต่ำกว่า 0 → ราคาซื้อขายต่ำกว่า MA (แนวโน้มขาลง)
• สูงกว่าระดับบน → สภาวะซื้อเกินที่เป็นไปได้
• ต่ำกว่าระดับล่าง → สภาวะขายเกินที่เป็นไปได้
ในช่วงแนวโน้มที่แข็งแกร่ง ตัวชี้วัดอาจยังคงขยายตัวอยู่ เพื่อยืนยันความแข็งแกร่งของแนวโน้มแทนที่จะสัญญาณการกลับตัวทันที
🎯 ข้อดี
✔ ยืดหยุ่นสูงด้วย MA 10 ประเภทสำหรับสไตล์การเทรดที่แตกต่างกัน
✔ มีประโยชน์สำหรับทั้งกลยุทธ์กลับสู่ค่าเฉลี่ยและการดึงกลับของแนวโน้ม
✔ การคำนวณแบบเปอร์เซ็นต์ทำให้สอดคล้องกันในทุกเครื่องมือ
✔ ช่วยตรวจจับสภาวะตลาดที่ขยายตัวเกินไปได้อย่างรวดเร็ว
✔ ทำงานได้ดีร่วมกับตัวกรองแนวโน้มและการเคลื่อนไหวของราคา
💡 เหมาะสำหรับ
• การระบุการดึงกลับในตลาดที่มีแนวโน้ม
• การตรวจจับสภาวะซื้อเกิน/ขายเกินในตลาดที่เคลื่อนไหวในกรอบ
• การยืนยันแนวโน้มเทียบกับค่าเฉลี่ยเคลื่อนที่
• การสร้างกลยุทธ์เทรดอัตโนมัติ (cBots)
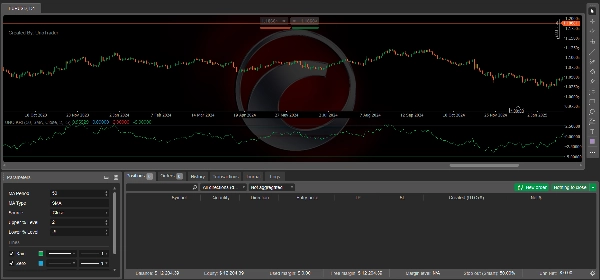
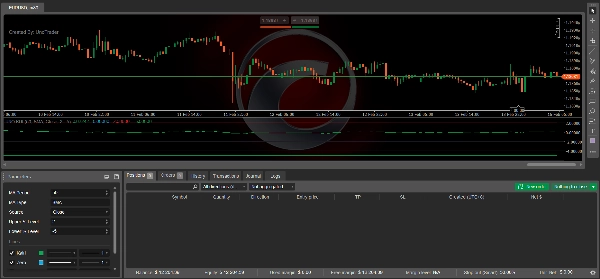
⚙️ การตั้งค่าพารามิเตอร์:
คำแนะนำ: ตรวจสอบให้แน่ใจว่าได้ตั้งค่าพารามิเตอร์โดยคลิกที่ไอคอนโฟลเดอร์ จากนั้นเลือกไฟล์ที่ดาวน์โหลดมา
ลิงก์พารามิเตอร์: กรุณาตรวจสอบวิดีโอบน YouTube และไปที่คำอธิบายเพื่อดูลิงก์สำหรับพารามิเตอร์
💡 เคล็ดลับการใช้งาน
🔹 การเก็งกำไรระยะสั้น: ความยาว 10–30, HMA/ZLEMA, ระดับ ±2–3
🔹 การเทรดสวิง: ความยาว 50–100, SMA/EMA/TMA, ระดับ ±5–10
🔹 การยืนยันแนวโน้ม: สังเกตว่า Kairi อยู่เหนือ 0 (แนวโน้มขาขึ้น) หรือ ต่ำกว่า 0 (แนวโน้มขาลง)
✅ สรุปคำแนะนำ
ตลาดที่ดีที่สุด: ฟอเร็กซ์หลัก & ทองคำ (มีสภาพคล่องและแนวโน้มที่คาดเดาได้)
ตลาดรอง: ดัชนี & สกุลเงินดิจิทัล (ใช้เกณฑ์ที่กว้างขึ้นเนื่องจากความผันผวนสูง)
💡 เคล็ดลับมือโปร:
ใช้ HMA หรือ ZLEMA สำหรับทองคำหรือตลาดที่ผันผวน ใช้ SMA/EMA สำหรับฟอเร็กซ์และดัชนีเพื่อสัญญาณที่นุ่มนวลขึ้น ปรับระดับบน/ล่างตามความผันผวน (เช่น ±2–3 สำหรับฟอเร็กซ์, ±5–10 สำหรับทองคำ)