present
ลงทะเบียนและรับส่วนลด $50 สำหรับการซื้อครั้งแรกของคุณ
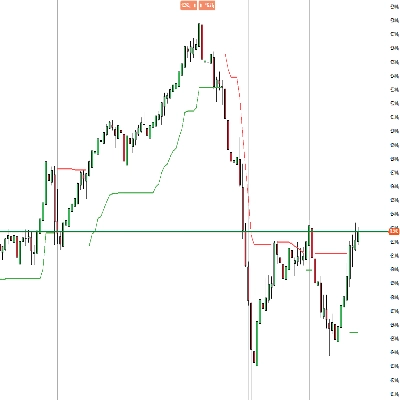
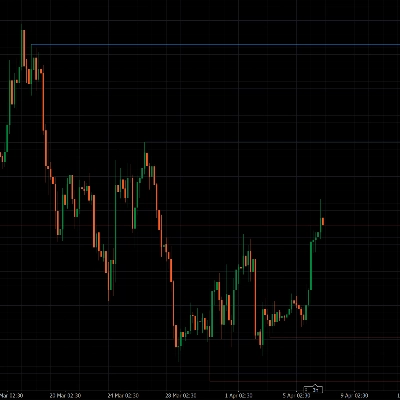
Trading product for fractal_high_low อินดิเคเตอร์ BTCUSD Prop, image 1
fractal_high_low
อินดิเคเตอร์
212 ดาวน์โหลด
เวอร์ชัน 1.1, Apr 2026
Windows, Mac
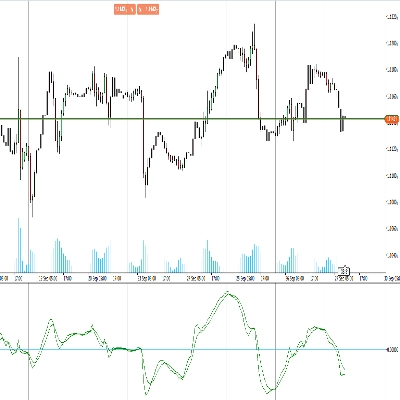
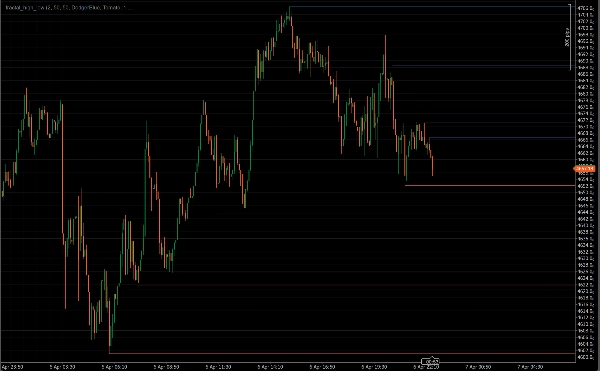
Trading product for fractal_high_low อินดิเคเตอร์ BTCUSD Prop, image 2
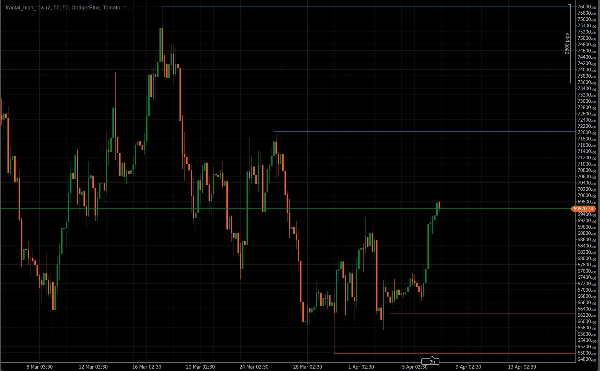
Trading product for fractal_high_low อินดิเคเตอร์ BTCUSD Prop, image 3
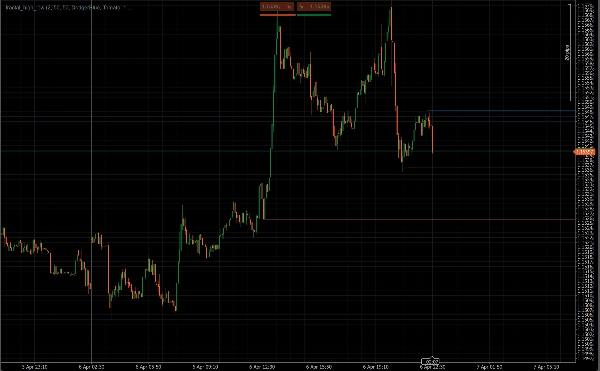
Trading product for fractal_high_low อินดิเคเตอร์ BTCUSD Prop, image 4
Trading product for fractal_high_low อินดิเคเตอร์ BTCUSD Prop, image 5
ตั้งแต่ 20/09/2025
223.5M
ปริมาณการเทรด
1.31M
Pips ที่ได้กำไร
212
ติดตั้งฟรี

คำอธิบาย

หากคุณเทรดด้วยการเคลื่อนไหวของราคา คุณก็รู้แล้วว่าระดับที่สำคัญที่สุดบนกราฟใด ๆ คือจุดสูงและต่ำของแฟรคทัล —

จุดสวิงที่ราคาปฏิเสธ กลับตัว หรือทำลายโครงสร้าง

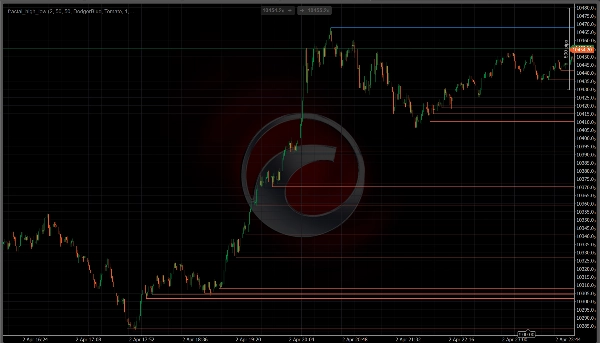
Frac High Low Lines จะค้นหาจุดเหล่านั้นให้คุณ

และวาดให้โดยอัตโนมัติ เพื่อให้คุณสามารถมุ่งเน้นไปที่

การอ่านราคาแทนการจัดการการวาดรูป


──────────────────────────────────────────────────────────

วิธีการทำงาน

──────────────────────────────────────────────────────────


อินดิเคเตอร์ใช้ตรรกะแฟรคทัลแบบคลาสสิกของ Williams เพื่อยืนยัน

จุดหมุน จุดสูงแฟรคทัลจะถูกต้องก็ต่อเมื่อจุดสูงนั้น

สูงกว่าบาร์รอบข้างทั้งสองด้านอย่างเคร่งครัด จุดต่ำแฟรคทัลจะถูกต้องก็ต่อเมื่อจุดต่ำ

ต่ำกว่าอย่างเคร่งครัด

เมื่อได้รับการยืนยันแล้ว จะมีการวาดเส้นแนวนอนจากจุดหมุน

และขยายไปข้างหน้า — ให้การอ้างอิงภาพที่ชัดเจน

สำหรับทุกระดับโครงสร้างที่สำคัญบนกราฟ


ไม่มีการวาดซ้ำ แฟรคทัลจะได้รับการยืนยันหลังจากที่บาร์

ปิดครบทั้งสองด้าน ดังนั้นระดับจะไม่ปรากฏและ

หายไปตามการเคลื่อนไหวของราคา


──────────────────────────────────────────────────────────

คุณสมบัติหลัก

──────────────────────────────────────────────────────────


• ตรวจจับแฟรคทัลอัตโนมัติ — สแกนบาร์ทั้งหมดเมื่อโหลด จากนั้น

อัปเดตแบบเรียลไทม์เมื่อบาร์ใหม่เกิดขึ้น


• กำหนดช่วงแฟรคทัลได้ — ใช้ช่วง 2 สำหรับทุก

สวิงเล็ก ๆ หรือเพิ่มขึ้นเพื่อแยกเฉพาะจุดสูงและต่ำ

โครงสร้างหลัก


• ควบคุมจำนวนเส้นสูงสุด — จำกัดจำนวนเส้น

แนวต้านและแนวรับที่แสดงพร้อมกัน เพื่อให้กราฟของคุณ

สะอาดและเน้นโครงสร้างล่าสุด


• ลบระดับที่ถูกทำลาย — เลือกลบเส้นโดยอัตโนมัติ

เมื่อราคาปิดผ่านเส้นนั้น เพื่อให้แสดงเฉพาะระดับที่ไม่ถูกทำลาย

เท่านั้น


• ควบคุมภาพได้เต็มที่ — ตั้งค่าสี ความหนา และรูปแบบเส้น

(ทึบ ขีด จุด) แยกกันสำหรับจุดสูงและต่ำ


• น้ำหนักเบา — แต่ละเส้นถูกวาดเพียงครั้งเดียวและไม่ถูกวาดซ้ำ,

ดังนั้นประสิทธิภาพจึงลื่นไหลแม้บนกราฟ M1 หรือ M5


──────────────────────────────────────────────────────────

เหมาะสำหรับใคร

──────────────────────────────────────────────────────────


สร้างขึ้นโดยเฉพาะสำหรับเทรดเดอร์ที่ใช้การเคลื่อนไหวของราคาโดยใช้จุดสูงและต่ำของสวิงเพื่อระบุโครงสร้าง วางแผนการเข้าทำรายการ ตั้งจุดหยุดขาดทุน และสังเกตโซนที่อาจเกิดการกลับตัวหรือเบรคเอาท์ ใช้ได้กับสัญลักษณ์และกรอบเวลาทุกประเภทใน cTrader


──────────────────────────────────────────────────────────

ฟรี — ไม่มีข้อผูกมัด

──────────────────────────────────────────────────────────


Frac High Low Lines ฟรีทั้งหมด ติดตั้ง เพิ่มลงในกราฟของคุณ และเทรดด้วยระดับโครงสร้างที่ชัดเจนขึ้นตั้งแต่เซสชันแรก


==========================================================

สรุป

สรุปโดย AI
fractal_high_low is an indicator designed for price action traders to automatically identify and plot fractal high and low lines on trading charts. It uses classic Williams fractal logic to detect pivot points where price has reversed or broken structure, confirming fractal highs when a bar’s high is strictly greater than its neighbors, and fractal lows when a bar’s low is strictly lower. Upon confirmation, horizontal lines are drawn from these pivot points and extended forward, providing clear visual references for significant support and resistance levels.

The indicator updates in real time as new bars form and scans all bars on load. It offers configurable fractal periods to capture minor or major swings, controls to limit the number of displayed lines for clarity, and an option to automatically remove lines when price closes through them. Users can customize line color, thickness, and style independently for highs and lows. The indicator is lightweight, drawing each line once to maintain smooth performance even on low timeframes like M1 or M5.

fractal_high_low works on any symbol and timeframe within the cTrader platform and supports markets including Forex, stocks, commodities, indices, and cryptocurrencies. It aids traders in identifying market structure, planning entries, setting stops, and spotting reversal or breakout zones.

โปรไฟล์อินดิเคเตอร์
หมวดหมู่อินดิเคเตอร์
โครงสร้างตลาด (SMC)
ประเภทเอาต์พุต
สัญญาณ
การแสดงเป็นภาพ
ข้อกำหนดด้านข้อมูล
แท่งเท่านั้น
สัญญาณที่รองรับ
แตะ Level ที่ระบุ
เบรก Level ที่ระบุ

การสนทนา

รีวิวจากลูกค้า

0.0
รีวิว: 0
รีวิวจากลูกค้า
ยังไม่มีรีวิวสำหรับผลิตภัณฑ์นี้ หากเคยลองแล้ว ขอเชิญมาเป็นคนแรกที่บอกคนอื่น!

คำถามที่พบบ่อย

BTCUSD
Prop
Forex
Scalping
Indices
EURUSD
Commodities
Crypto
Stocks
XAUUSD
NAS100
ผลิตภัณฑ์ที่มีให้บริการผ่าน cTrader Store รวมถึงบอทการเทรด อินดิเคเตอร์ และปลั๊กอิน มีให้บริการโดยนักพัฒนาบุคคลที่สามและมีไว้เพื่อวัตถุประสงค์ในการเข้าถึงข้อมูลและทางเทคนิคเท่านั้น cTrader Store ไม่ใช่โบรกเกอร์และไม่ได้ให้คำแนะนำการลงทุน คำแนะนำส่วนบุคคล หรือการรับประกันผลการดำเนินงานในอนาคต

นอกจากนี้คุณยังอาจชอบ

อินดิเคเตอร์
RSI
VWAP
+5
Trend direction, chart signals, reversal zones and volume tools in one configurable indicator.
อินดิเคเตอร์
Volume
Key Levels
View tick activity across a selected chart range with Point of Control, Value Area High and Value Area Low.
อินดิเคเตอร์
ATR
BOS
+5
Market structure with BOS and CHoCH, order blocks, and retest buy/sell arrows with entry, stop and two targets
อินดิเคเตอร์
ATR
Prop
+14
Optimize exits with Chandelier Exit! Visualize stop-loss points dynamically for improved trading precision and safety.
อินดิเคเตอร์
Forex
BTCUSD
+10
Enhance trading with TSI! Use the True Strength Index for clear insights into market momentum and trend strength.
"SMC + FVG Binary Signal Pro" โลโก้
เรตติ้งสูง
4.0
(4)
$29
/
$49
อินดิเคเตอร์
ATR
RSI
+20
SMC/ICT signals using FVG + liquidity sweep/MSS with EMA-RSI-MACD filters, clear visuals, and actionable alerts.
อินดิเคเตอร์
[Hamster-Coder] Pivot Points (Demo)
อินดิเคเตอร์
Order Block
Breaker Block
+5
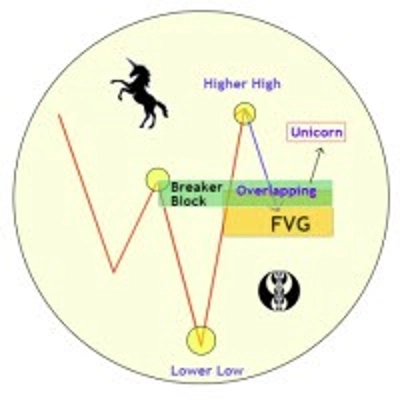
Unicorn Model ICT Indicator — Smart Trading with Precision
อินดิเคเตอร์
RSI
Fibonacci
+1
Spot RSI divergences on your chart and get an entry, stop and six targets when your filters line up.
อินดิเคเตอร์
BOS
MSS
+3
Orderblocks with Multi-Timeframe.
"LT_Ind_SRZones" โลโก้
ยอดนิยม
4.5
(6)
$19
/
$25
อินดิเคเตอร์
Prop
Forex
+4
Automatic Support/Resistance zones from swing points.
อินดิเคเตอร์
ATR
Forex
+6
It combines swing (pivot-based) market structure detection with Gann Fan geometry and Fibonacci retracement/extension
อินดิเคเตอร์
VWAP
Support & Resistance
Trading.FC$_vwap Algo shows VWAP trends, dynamic support/resistance and deviation bands to spot potential trade entries.
อินดิเคเตอร์
ATR
RSI
+8
Detects bullish and bearish divergences
อินดิเคเตอร์
ADX
Breaker Block
+1
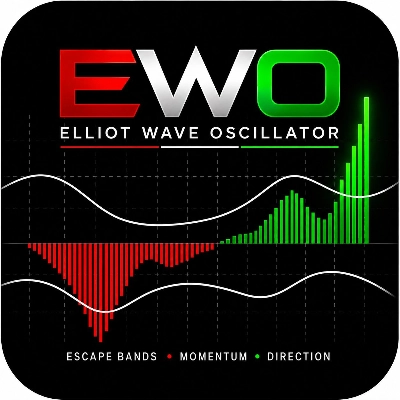
I share with you the Elliott Wave Oscillator. Hernan Nievas, Rosario, Argentina. April 28, 2026.
อินดิเคเตอร์
EMA
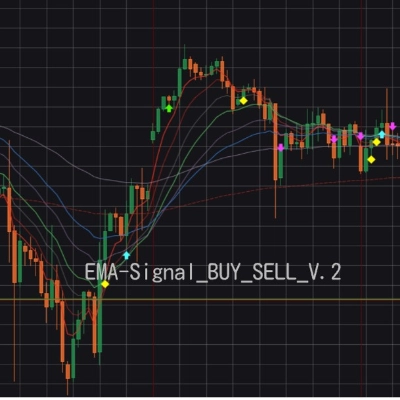
Visualize convergence, breakouts, and trends. Target
อินดิเคเตอร์
Prop
Forex
+13
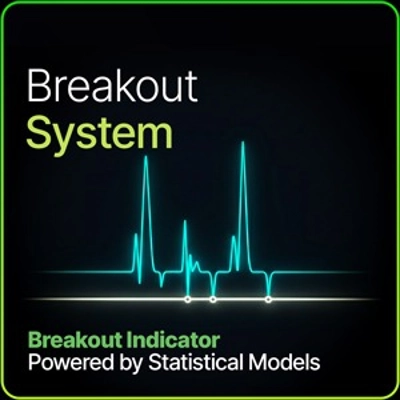
Identifies market compression zones and explosive Breakout moments using mathematical modeling.
"Boris Indicator" โลโก้
เรตติ้งสูง
4.6
(5)
$19
/
$28
อินดิเคเตอร์
AI
Grid
+17
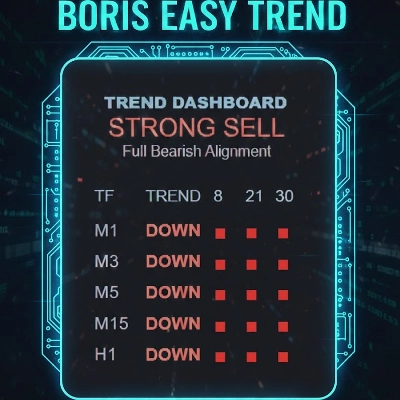
BORIS Easy Trend: Relax & scalp with 6-TF alignment. Clear BUY/SELL signals & movable UI/HUD make trading effortless.

ราคา

ตั้งแต่ 20/09/2025
223.5M
ปริมาณการเทรด
1.31M
Pips ที่ได้กำไร
212
ติดตั้งฟรี