present
Kaydolun ve ilk alışverişinizde $50 indirim kazanın
Trading product for AW Multi Data Gösterge, image 1
AW Multi Data
5.62K
Ücretsiz yüklemeler

Açıklama

Özet

YZ özeti
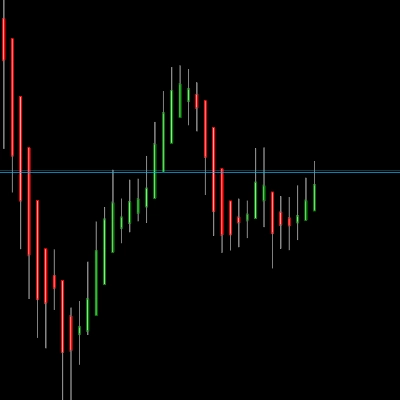
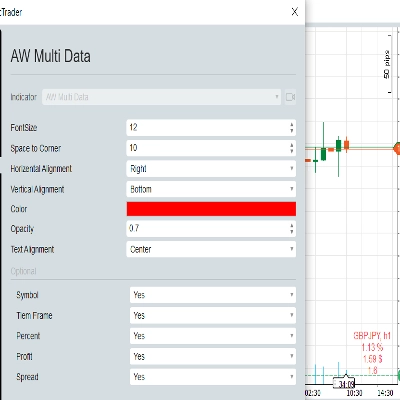
AW Multi Data is a trading indicator that displays key trading metrics directly on your chart. It shows the current symbol and timeframe, daily net profit percentage, daily net profit amount, and spread. The indicator requires the timezone to be set to UTC to accurately reflect daily profit values. This tool provides real-time performance data to assist traders in monitoring their trades within the charting interface.
Gösterge profili

Tartışma

Müşteri değerlendirmeleri

0.0
Değerlendirmeler: 0
Müşteri değerlendirmeleri
Bu ürün için henüz bir değerlendirme yok. Ürünü denediniz mi? O zaman ona dair görüşlerini paylaşan ilk kişi olun!

SSS

cTrader Store üzerinden erişilebilen işlem botları, göstergeler ve eklentiler gibi ürünler, üçüncü taraf sağlayıcılar tarafından sağlanır ve yalnızca bilgilendirme ve teknik erişim amaçlarıyla sunulur. cTrader Store bir broker değildir ve yatırım tavsiyesi, kişisel öneriler vermez veya gelecekteki performansı garanti etmez.

Bu oluşturanın diğer ürünleri
"IR Candle MTF" logosu
4.6
(6)
Ücretsiz
with this indicator you could see other time frame candle in your chart.
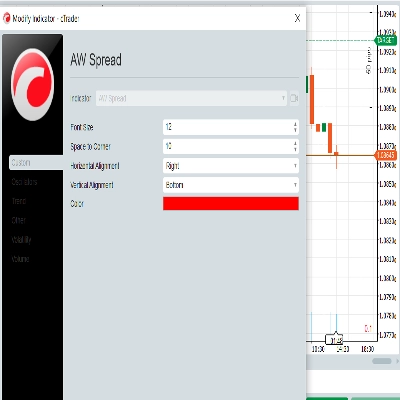
show spread on chart
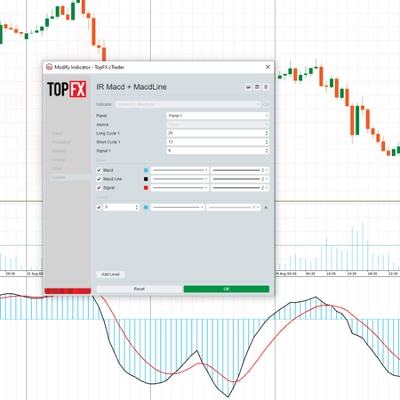
some user add moving average to macd to see better. in ctrader 4.3.11 there is a problem with this . I make a macd tha
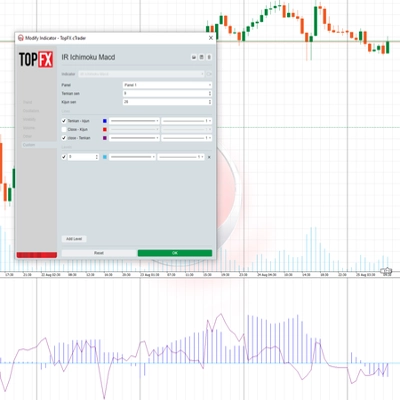
this indicator show macd on chart.
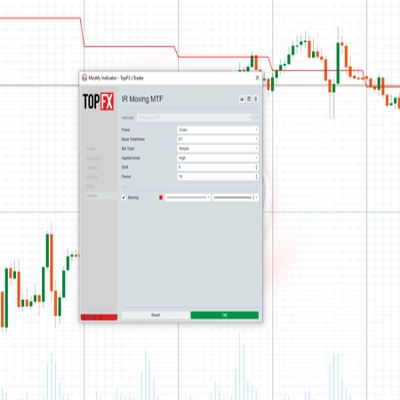
Multi Time Frame Moving Average is a powerful and flexible indicator for cTrader
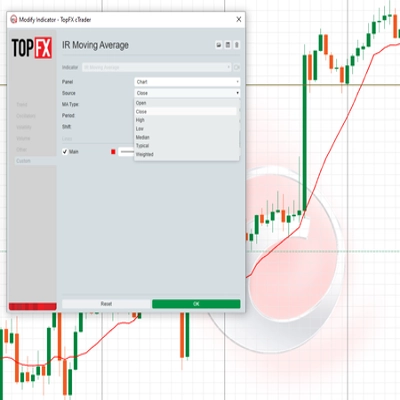
 this moving include everything that a trader needs from Moving Average.
this indicaotr show distance between Tenkan to Kijun, Close to Kijun and Close to Tenkan 
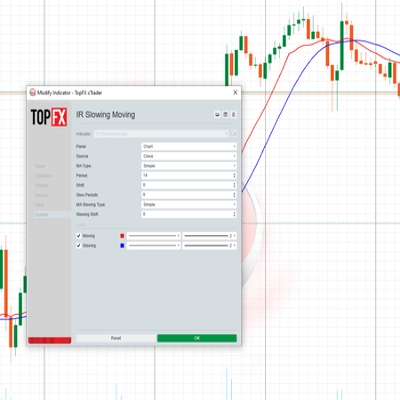
Add Slowing to IR Moving Average.
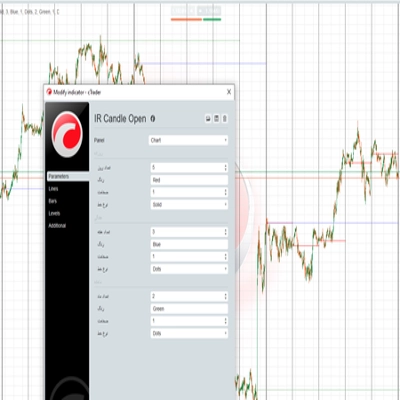
IR Candle Open plots customizable opening price lines for daily, weekly, and monthly candles
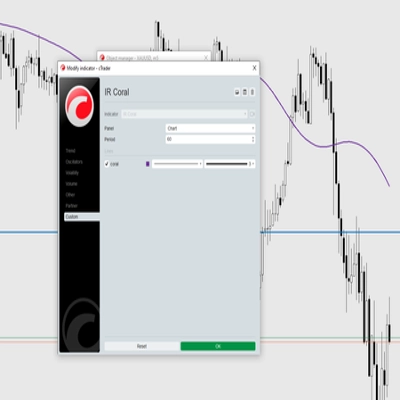
Coral indicator
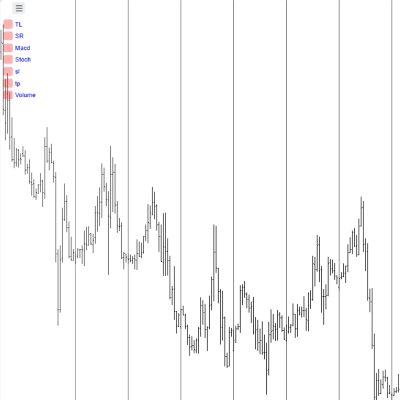
you could put your check list in your chart you could split your test with “,” you could put your checklist in indicat
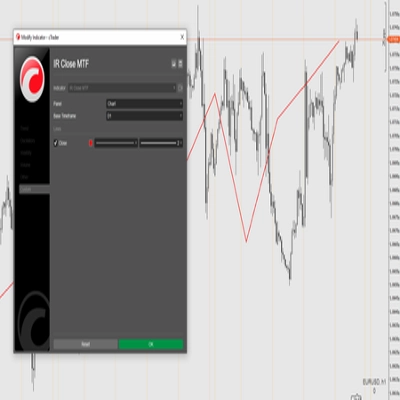
this indicator show other time frame close in lower time frame. for ex: show daily close in m 15.

Şunları da beğenebilirsiniz

Easy Trade: Trend & Breakout Indicator for cTrader
Identifies market trends (-10 to +10) using HMA with volume confirmation. Includes customizable alerts.
Multi-symbol multi-timeframe SuperTrend panel with watchlist, one-click jump, and alerts.
"Average Cost Price" logosu
4.5
(4)
$25
/
$39
Average Cost Price helps you keep track of your open positions on the chart. In doing so, it provides lines and explanat
AI-powered daily range forecasts help traders spot volatility opportunities and plan stops and targets.
Identify market structure effortlessly with swing highs, lows, CHoCH, and BOS levels for smart trading decisions! 📊🔍"
Market structure with BOS and CHoCH, order blocks, and retest buy/sell arrows with entry, stop and two targets
Session VWAP with standard deviation bands, previous session level, custom anchor time, and crossover alerts.
you could put your check list in your chart you could split your test with “,” you could put your checklist in indicat
Clean 3D, Sleek Candles for Trend Patterns.
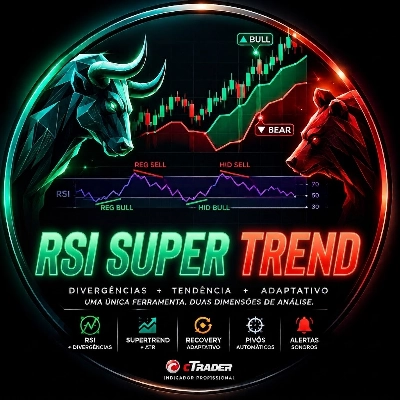
Super Trend Rsi ,ATR + trend change distance + dynamic Alpha, divergence/convergence
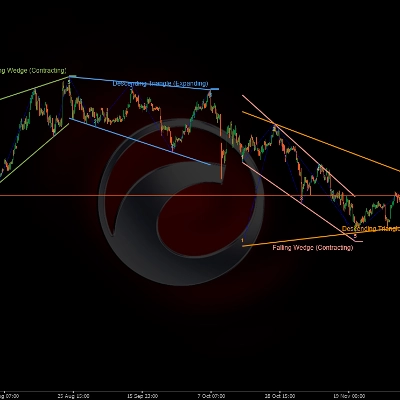
🎯Automatically detects and visualizes classical chart patterns using multi-timeframe swing point analysis.
"Swing Points" logosu
4.5
(6)
$19
Multi-Timeframe Swing Points Indicator for cTrader that identifies swing highs and lows on both the current timeframe.
Professional position management! Calculate real-time pivots, monitor P&L & costs, and strengthen your strategy.
Enhance trading with ATR Bands! Visualize market volatility using dynamic upper and lower ATR bands for precise decision
Multi-symbol, multi-timeframe Fair Value Gaps in one panel.
Trade the Trend Flip. Control the Risk. 🎯📈”
A professional-grade cTrader indicator for traders following the Inner Circle Trader (ICT) methodology. It replaces 6–8

Fiyat

5.62K
Ücretsiz yüklemeler