

คำอธิบาย
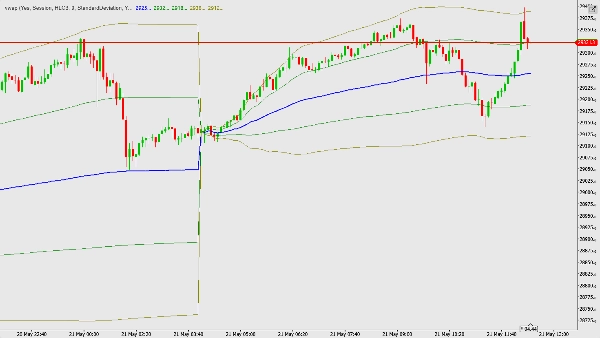
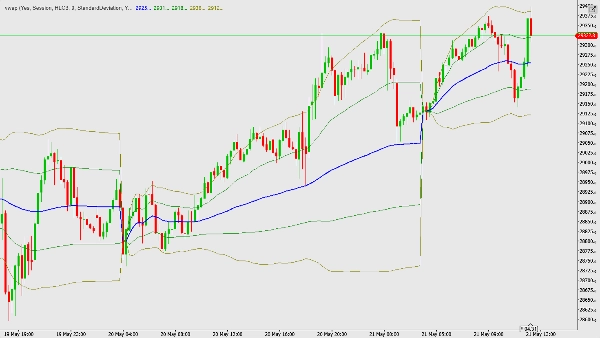
Volume-Weighted Average Price (VWAP) with Standard Deviation Bands
Description: The Volume-Weighted Average Price (VWAP) is one of the most powerful and widely used intraday indicators for professional traders. It serves as a benchmark for determining value, market bias, and high-probability trade locations by factoring in both price action and transaction volume.
This custom cTrader indicator has been built from the ground up to match TradingView’s standard VWAP layout and functionality while delivering maximum execution speed (O(1) efficiency) and a zero-repainting option.
Key Features:
- Dynamic Anchor Resets: Reset calculations at the start of any period, including Session, Week, Month, Quarter, Year, Decade, or Century. It also includes fallback support for corporate events (Earnings, Dividends, Splits).
- 3 Independent Deviation Bands: Plot up to three upper and lower bands. Each band can be toggled on/off and configured with its own multiplier.
- Dual Band Modes: Calculate band distances using Standard Deviation (volatility-based) or Percentage (fixed distance, e.g., 1.0 = 1%).
- Zero Repainting (Wait for Close): When enabled, the indicator locks the developing bar's value to the previous bar's closed value, ensuring historical data remains stable and lines do not repaint dynamically mid-bar.
- Smart Daily Filter: The indicator can automatically hide itself on Daily (D1) charts and above, keeping your high-timeframe charts clean.
- 8 Price Source Formulas: Select from Open, High, Low, Close, HL2, HLC3 (Typical), OHLC4, or HLCC4.
How to Trade Using this Indicator:
- Establish Daily Bias: Use a volume profile or trend analysis at the session open. If the market is bullish, look strictly for buys. If bearish, look strictly for sells.
- Buy Signals: In a bullish market, wait for the price to pull back to the Central VWAP line (Blue). Enter buy orders on a bullish rejection candle (green candle) that touches and closes above the VWAP line.
- Sell Signals: In a bearish market, wait for the price to rally up to the Central VWAP line (Blue) from below. Enter sell orders on a bearish rejection candle (red candle) that touches and closes below the VWAP line.
- Overextension Guard: Do not buy when price is trading at or above the Upper Band #2 (+2.0 SD) or sell when price is trading at or below the Lower Band #2 (-2.0 SD) to avoid trading at local exhaustion points.
Parameter Configurations:
- Hide VWAP on 1D or Above: (Yes/No) Hides indicator lines on Daily/Weekly/Monthly timeframes.
- Anchor Period: Choose the time anchor for resets (Default: Session).
- Source: Choose the price series input (Default: HLC3 Typical price).
- Offset: Shift plots into the past or future.
- Bands Calculation Mode: Toggle between Standard Deviation and Percentage.
- Show Band 1 / 2 / 3: (Yes/No) Enable/disable specific bands.
- Multiplier #1 / #2 / #3: Adjust the width of individual deviation bands.
- Wait for timeframe closes: (Yes/No) Locks values to prevent repainting.
Summary Cheatsheet:
Buy (Long) Signals:
- Daily Bias Filter: Price must open above yesterday's VAH.
- Entry Area: Near the Blue VWAP line (from above).
- Candle Trigger: Green rejection candle closing above VWAP.
- Stop Loss: Below the Lower Band #1 or #2.
- Take Profit: Upper Band #2 (+2.0 SD).
Sell (Short) Signals:
- Daily Bias Filter: Price must open below yesterday's VAL.
- Entry Area: Near the Blue VWAP line (from below).
- Candle Trigger: Red rejection candle closing below VWAP.
- Stop Loss: Above the Upper Band #1 or #2.
- Take Profit: Lower Band #2 (-2.0 SD).
สรุป
โปรไฟล์อินดิเคเตอร์
หมวดหมู่อินดิเคเตอร์
Momentum
ประเภทเอาต์พุต
สัญญาณ
ข้อกำหนดด้านข้อมูล
แท่งเท่านั้น
สัญญาณที่รองรับ
Cross
รีวิวจากลูกค้า
0.0
รีวิว: 0
รีวิวจากลูกค้า
ยังไม่มีรีวิวสำหรับผลิตภัณฑ์นี้ หากเคยลองแล้ว ขอเชิญมาเป็นคนแรกที่บอกคนอื่น!
การสนทนา
คำถามที่พบบ่อย
Volume
VWAP
Support & Resistance
ผลิตภัณฑ์ที่มีให้บริการผ่าน cTrader Store รวมถึงบอทการเทรด อินดิเคเตอร์ และปลั๊กอิน มีให้บริการโดยนักพัฒนาบุคคลที่สามและมีไว้เพื่อวัตถุประสงค์ในการเข้าถึงข้อมูลและทางเทคนิคเท่านั้น cTrader Store ไม่ใช่โบรกเกอร์และไม่ได้ให้คำแนะนำการลงทุน คำแนะนำส่วนบุคคล หรือการรับประกันผลการดำเนินงานในอนาคต
!["[Stellar Strategies] BOS Trend 1.0" โลโก้](https://cdn.ctrader.com/image/webp/6cdec0f1-0e97-4a82-a8a4-2b67aed54d38_25695)















ราคา
ตั้งแต่ 10/03/2026
130
ติดตั้งฟรี