present
ลงทะเบียนและรับส่วนลด $50 สำหรับการซื้อครั้งแรกของคุณ
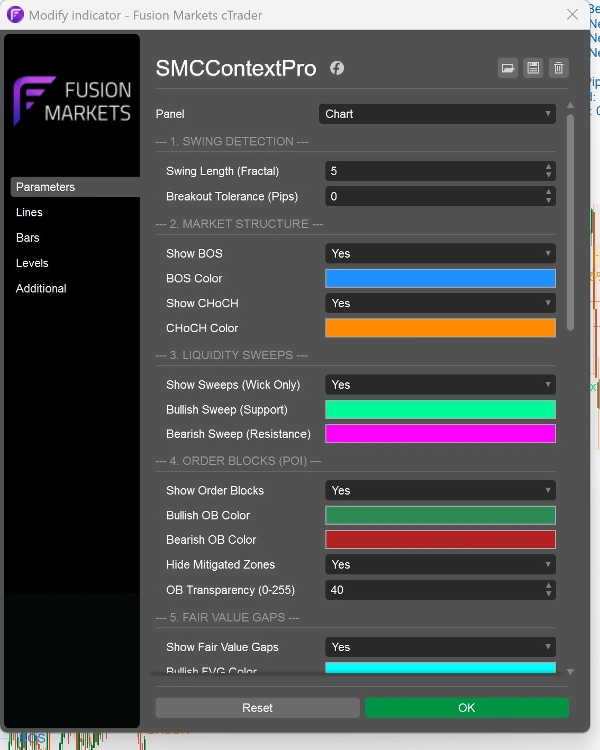
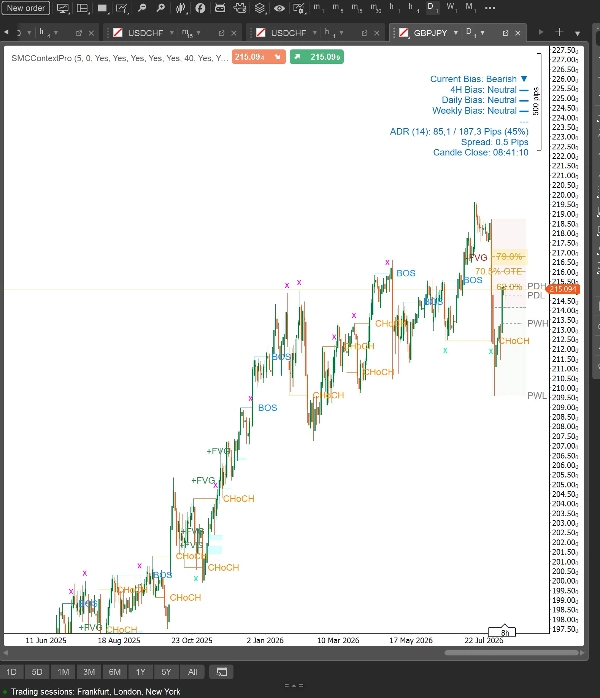
Trading product for SMCContextPro อินดิเคเตอร์ Premium/Discount  Fair Value Gap, image 1
SMCContextPro
อินดิเคเตอร์
เวอร์ชัน 2.4, Oct 2026
Windows, Mac
Trading product for SMCContextPro อินดิเคเตอร์ Premium/Discount  Fair Value Gap, image 2
Trading product for SMCContextPro อินดิเคเตอร์ Premium/Discount  Fair Value Gap, image 3
ตั้งแต่ 09/03/2026
2
การขาย
286
ติดตั้งฟรี

คำอธิบาย

SMCContextPro เป็นตัวบ่งชี้โครงสร้างตลาดสำหรับ cTrader ที่อิงตามแนวคิด Smart Money Concepts (SMC) มันทำแผนที่โครงสร้างสวิง, การแตกโครงสร้าง (BOS), การเปลี่ยนลักษณะ (CHoCH), บล็อกคำสั่ง, ช่องว่างมูลค่ายุติธรรม, การกวาดสภาพคล่อง และระดับสำคัญในกรอบเวลาที่สูงกว่าบนแผนภูมิเดียว พร้อมด้วยการแจ้งเตือนเสียงและป๊อปอัพที่เป็นทางเลือก


ประเภทตัวบ่งชี้: โครงสร้างตลาด / การเคลื่อนไหวราคา (ซ้อนทับ)

เครื่องมือที่แนะนำ: ฟอเร็กซ์หลักและคู่ข้าม, ทองคำ, ดัชนีหลัก

ช่วงเวลาที่แนะนำ: m5 ถึง h4 (ทำงานได้กับช่วงเวลาทุกประเภทที่อิงตามเวลา)

แพลตฟอร์ม: cTrader Windows และ Mac

กรณีการใช้งานการซื้อขาย: การซื้อขายภายในวันและสวิง, การระบุจุดที่น่าสนใจ, การวางกรอบการซื้อขายรอบระดับสภาพคล่อง และการยืนยันแนวโน้มทิศทางในหลายกรอบเวลา


วิธีการทำงาน


การตรวจจับสวิง

- จุดสูงและต่ำของสวิงถูกตรวจจับด้วยวิธี fractal การยืนยันสวิงเกิดขึ้นหลังจากแท่งเทียนจำนวนที่ตั้งไว้ (Swing Length, ค่าเริ่มต้น 5) ปิดทั้งสองด้าน ดังนั้นสวิงจึงปรากฏด้วยความล่าช้านั้นและจะไม่เปลี่ยนแปลงหลังจากนั้น

- สวิงจะถูกติดป้ายว่า HH, LH, HL หรือ LL เทียบกับสวิงก่อนหน้าของชนิดเดียวกัน

- ตัวกรอง ATR ที่เป็นทางเลือกจะละเลยสวิงขนาดเล็ก

- ระดับสวิงที่ไม่ได้รับการบรรเทาจะถูกวาดเป็นเส้นและถูกลบออกทันทีที่ราคาสัมผัส คุณเลือกจำนวนระดับที่จะเก็บต่อด้านและว่าจะโชว์เฉพาะสวิงหลัก (HH / LL) หรือไม่


โครงสร้างตลาด

- BOS และ CHoCH ถูกประเมินเมื่อแท่งเทียนปิด พร้อมด้วยความทนทานในการเบรคเอาท์ในหน่วยพิปที่เป็นทางเลือก

- การกวาดสภาพคล่องจะถูกทำเครื่องหมายเมื่อไส้เทียนเกินระดับสวิงล่าสุดแต่ปิดกลับภายในระดับนั้น


สัญญาณกวาด (เป็นทางเลือก)

- ลูกศรซื้อและขายสามารถแสดงบนการกวาดสภาพคล่อง

- โหมดกรองสามแบบ: ทุกการกวาด; การกวาดที่มีไส้เทียนปฏิเสธขั้นต่ำ (% ของช่วงแท่งเทียน); หรือไส้เทียนปฏิเสธพร้อมกับความเห็นพ้องกับทิศทางโครงสร้างปัจจุบัน

- สัญญาณเป็นเครื่องหมายภาพเท่านั้น ไม่รวมระดับการเข้า, หยุดขาดทุน หรือทำกำไร


บล็อกคำสั่งและช่องว่างมูลค่ายุติธรรม

- บล็อกคำสั่ง: แท่งเทียนตรงข้ามสุดท้ายก่อน BOS หรือ CHoCH ค้นหาภายในหน้าต่างย้อนกลับ

- ช่องว่างมูลค่ายุติธรรม: ความไม่สมดุลของแท่งเทียนสามแท่ง ทำเครื่องหมาย +FVG และ -FVG

- โซนที่ไม่ได้รับการบรรเทาขยายไปยังแท่งเทียนปัจจุบัน เมื่อราคาซื้อขายในโซนจะถูกซ่อนหรือทำให้มืดลง (ตามที่คุณเลือก)

- สี่เหลี่ยมโซนถูกล็อกเพื่อไม่ให้เคลื่อนย้ายโดยไม่ตั้งใจขณะทำงานบนแผนภูมิ


พรีเมียม, ส่วนลด และ OTE

- โซนพรีเมียมและส่วนลดพร้อมเส้นสมดุล 50% วาดบนช่วงสวิงล่าสุด

- ระดับ OTE ที่เป็นทางเลือกที่ 62%, 70.5% และ 79% จัดทิศทางไปยังทิศทางโครงสร้างปัจจุบัน


ระดับสภาพคล่องสำคัญ

- จุดสูงและต่ำของวัน, สัปดาห์ และเดือนก่อนหน้า

- จุดสูงและต่ำของวันจันทร์ในสัปดาห์ปัจจุบัน และจุดสูงและต่ำของวันศุกร์ก่อนหน้า

- เส้นวันจันทร์และวันศุกร์จะถูกซ่อนเมื่อซ้อนทับกับเส้นวันก่อนหน้า

- สี, ความหนา และรูปแบบเส้นสามารถปรับได้สำหรับแต่ละระดับ


เครื่องมือแผนภูมิ

- ตัวแบ่งวันพร้อมป้ายวันในสัปดาห์ พร้อมตัวเลือกผสานวันอาทิตย์เข้ากับวันจันทร์

- EMA เร็วและช้า (ค่าเริ่มต้น 20 และ 50)

- พื้นหลังแผนภูมิสีขาวเป็นทางเลือก พื้นหลังเดิมจะถูกคืนเมื่อเอาตัวบ่งชี้ออก


แผงข้อมูล

- แนวโน้มโครงสร้างปัจจุบัน (ขาขึ้น, ขาลง หรือเป็นกลาง)

- แนวโน้มง่ายๆ ที่อิง fractal สำหรับ h4, รายวัน และรายสัปดาห์

- ช่วงวันนี้เทียบกับค่าเฉลี่ยช่วงวัน 14 วัน ในหน่วยพิปและเปอร์เซ็นต์

- สเปรดปัจจุบันในหน่วยพิป

- นับถอยหลังถึงการปิดแท่งเทียน (อัปเดตทุกวินาที)


การแจ้งเตือน

- การแจ้งเตือนเสียงและป๊อปอัพสำหรับ BOS, CHoCH, การกวาดสภาพคล่อง, สัญญาณกวาด, การบรรเทาบล็อกคำสั่งและ FVG, และการสัมผัสระดับวัน, สัปดาห์ และเดือนก่อนหน้า, วันจันทร์ และวันศุกร์

- การแจ้งเตือนจะทำงานเฉพาะราคาสดเท่านั้น ไม่ทำงานกับแท่งเทียนย้อนหลัง การอุ่นเครื่องสั้นๆ หลังโหลดช่วยป้องกันการแจ้งเตือนเมื่อเปลี่ยนแผนภูมิหรือกรอบเวลา

- การแจ้งเตือนทำงานขณะที่ cTrader กำลังทำงาน ไม่ต้องตั้งค่าอีเมล


ประสิทธิภาพ

- ตรวจสอบเฉพาะโซนและระดับที่ไม่ได้รับการบรรเทาในแต่ละทิก

- เส้นระดับและโซนจะถูกวาดใหม่เมื่อมีแท่งเทียนใหม่หรือเมื่อโครงสร้างเปลี่ยน ไม่ใช่ทุกทิก

- จำนวนวัตถุประวัติศาสตร์บนแผนภูมิสามารถปรับได้


หมายเหตุ

- เวลาทั้งหมด, ตัวแบ่งวัน และระดับรายวัน, รายสัปดาห์ และรายเดือน ใช้เวลา UTC

- การนับถอยหลังแท่งเทียนออกแบบมาสำหรับแผนภูมิที่อิงตามเวลา


สำคัญ

SMCContextPro เป็นเครื่องมือวิเคราะห์และวาดแผนภูมิ มันทำเครื่องหมายโครงสร้าง, โซน และระดับ และแสดงสรุปแนวโน้ม มันไม่ทำการซื้อขายและไม่ทำนายการเคลื่อนไหวราคาล่วงหน้า สัญญาณและโซนอาจล้มเหลว ดังนั้นควรใช้การจัดการความเสี่ยงและขนาดตำแหน่งของคุณเองเสมอ และทดสอบในบัญชีทดลองก่อนการซื้อขายจริง


การซื้อขายมีความเสี่ยง ผลการดำเนินงานในอดีตไม่รับประกันผลลัพธ์ในอนาคต

สรุป

สรุปโดย AI
SMCContextPro is a market structure indicator designed for the cTrader platform (Windows and Mac) that applies Smart Money Concepts (SMC) to analyze price action. It identifies and visualizes key market elements including swing highs and lows, break of structure (BOS), change of character (CHoCH), order blocks, fair value gaps (FVGs), liquidity sweeps, and higher-timeframe key levels such as previous day, week, and month highs and lows. The indicator supports timeframes from 5 minutes to 4 hours and is optimized for Forex majors and crosses, gold, and major indices.

Key features include fractal-based swing detection with adjustable filters, visual marking of unmitigated swing levels, and optional audio and popup alerts for significant events like BOS, CHoCH, liquidity sweeps, and zone mitigations. It also displays premium and discount zones with equilibrium lines and optional optimal trade entry (OTE) levels. Additional chart tools include day separators, fast and slow EMAs, and a customizable info panel showing current structure bias, daily range statistics, spread, and candle close countdown.

SMCContextPro provides visual signals and structural analysis to assist intraday and swing traders in identifying points of interest, framing trades around liquidity levels, and confirming directional bias across multiple timeframes. It does not execute trades or predict future price movements.

โปรไฟล์อินดิเคเตอร์
หมวดหมู่อินดิเคเตอร์
โครงสร้างตลาด (SMC)
ประเภทเอาต์พุต
การแสดงเป็นภาพ
สัญญาณ
ข้อกำหนดด้านข้อมูล
แท่งเท่านั้น

การสนทนา

รีวิวจากลูกค้า

0.0
รีวิว: 0
รีวิวจากลูกค้า
ยังไม่มีรีวิวสำหรับผลิตภัณฑ์นี้ หากเคยลองแล้ว ขอเชิญมาเป็นคนแรกที่บอกคนอื่น!

คำถามที่พบบ่อย

Premium/Discount
Fair Value Gap
BOS
Order Block
CHOCH
Market Structure
Liquidity Grab
ผลิตภัณฑ์ที่มีให้บริการผ่าน cTrader Store รวมถึงบอทการเทรด อินดิเคเตอร์ และปลั๊กอิน มีให้บริการโดยนักพัฒนาบุคคลที่สามและมีไว้เพื่อวัตถุประสงค์ในการเข้าถึงข้อมูลและทางเทคนิคเท่านั้น cTrader Store ไม่ใช่โบรกเกอร์และไม่ได้ให้คำแนะนำการลงทุน คำแนะนำส่วนบุคคล หรือการรับประกันผลการดำเนินงานในอนาคต

เพิ่มเติมจากผู้เขียนคนนี้

อินดิเคเตอร์
Key Levels
Every major liquidity level drawn for you: PDH/PDL, PWH/PWL, PMH/PML and more. Same price on every timeframe. Free.
ปลั๊กอินเดสก์ท็อป
Trade Journal
Market Scanner
+2
Journal, stats, trade analysis, a daily coach and a daily bias for your real cTrader trades. Know why you lose; fix it.
อินดิเคเตอร์
Fair Value Gap
Auto-draws every Fair Value Gap on any timeframe and removes it once filled. Clean, fast, free. Built for cTrader.
ปลั๊กอินเดสก์ท็อป
SL Manager
Risk/Reward
+5
Drag SL & TP on the chart, see risk, reward, R:R and lot size live, then place Buy or Sell orders in one click
อินดิเคเตอร์
BOS
CHOCH
+1
BoS & CHoCH on any timeframe. Body-close confirmed, no repaint, exact swing levels, H1–Monthly trend dashboard.
ปลั๊กอินเดสก์ท็อป
Prop Firm Fit
Trade Journal
+1
Paper trade your broker’s live prices in cTrader: demo accounts, prop challenges, a stats dashboard and trading journal
อินดิเคเตอร์
Order Block
Order blocks confirmed by BOS, displacement and FVG, plus up to 3 higher-timeframe levels on one chart. No repaint
ปลั๊กอินเดสก์ท็อป
Chart UI Tools
Replay your broker’s charts candle by candle. Rewind any time, switch timeframes and practise trades with full stats.
อินดิเคเตอร์
Key Levels
Support & Resistance
Day and week separators plus previous day high, low and close lines for every day on H1 and lower charts
อินดิเคเตอร์
EMA
Flag
+2
Liquidity levels, trend lines, filtered chart patterns and a composite bias HUD in one cTrader overlay.
อินดิเคเตอร์
EMA
Outlines the first candle of the real session open for indices, forex & crypto. Auto DST, HTF candle panel & EMA.
ปลั๊กอินเดสก์ท็อป
Balanced
Live M15, M30 and H1 candles inside your chart. Read 3-candle sweep-and-break setups across timeframes at a glance.

นอกจากนี้คุณยังอาจชอบ

"Sniper Ashfield Pro" โลโก้
เรตติ้งสูง
4.4
(5)
$29
/
$47
อินดิเคเตอร์
ADX
ATR
+5
EMA-cross signals scored on six confluence layers, with an ATR stop, three targets and a live panel
อินดิเคเตอร์
Key Levels
Support & Resistance
Clean psychological round-number grid with native pip and point auto-scaling across Forex, Gold, Indices, and Crypto.
"FairValueGap-PremiumVersion1" โลโก้
ยอดนิยม
4.5
(4)
$19
/
$20
อินดิเคเตอร์
Signal
This Fair Value Gap (FVG) indicator is a technical analysis on multi-timeframe.
อินดิเคเตอร์
Supertrend
Moving Average
Easy Trade: Trend & Breakout Indicator for cTrader
อินดิเคเตอร์
ADX
ATR
+5
Ten confluence layers scored on every closed bar, with an anti-chop gate, pivot levels and a live dashboard.
"LIQUIDITY POOL SIGNAL PRO" โลโก้
ยอดนิยม
4.0
(3)
$25
/
$50
อินดิเคเตอร์
Forex
BTCUSD
+5
INDICATOR,LIQUIDITY POOLS,ACCURATE SIGNAL, NO DELAY,80% PROBABILITY
อินดิเคเตอร์
ATR
Volume
+3
Volume profile key levels - POC, value area, volume peaks and troughs - with break, rejection and retest signals
"Axiom Matrix" โลโก้
ใหม่
4.6
(3)
$39
อินดิเคเตอร์
Volume
Support & Resistance
Compare up to 27 symbols across eight timeframes with seven analysis engines and an interactive cTrader dashboard.
"Dynamic Trend Gradient" โลโก้
เรตติ้งสูง
4.2
(5)
$19
/
$22
อินดิเคเตอร์
RSI
Signal
+2
Identifies trends with moving averages & volatility. Base levels = bullish 🐂 or bearish 🐻 signals. Reversals detected!
อินดิเคเตอร์
Volume
Key Levels
+1
Session volume profiles from tick volume: POC, value area high and low, and naked POCs extended until touched.
อินดิเคเตอร์
Indices
Custom ADX Indicator for precise trend analysis. المؤشر المخصص ADX لتحليل الاتجاه بدقة
อินดิเคเตอร์
Breakout
Allow trader to visualize Support & Resistance across different timeframes,give trader an overview of the current market
อินดิเคเตอร์
Volume
Channel
+2
Identify key support and resistance levels through detailed volume distribution analysis.
อินดิเคเตอร์
Drawdown Monitor
Protect your funded account. Real-time Daily Equity Drawdown monitor with Green / Orange / Red flashing alerts.
อินดิเคเตอร์
Forex
Crypto
+5
Experience a new approach with amplitude-based momentum analysis. Smart Trend Detection That Adapts to Market Volatility
อินดิเคเตอร์
The Weekly Daily Levels indicator shows the OHLC, and mid-point prices for the previous day and week.
อินดิเคเตอร์
Pin Bar
Inducement
+5
Institutional Nasdaq Session Liquidity Map with Live Point HUD, Sweep Alerts & Interactive Playbook.
อินดิเคเตอร์
VWAP
Volume
+4
Volume Profile + VWAP with Standard Deviations

ราคา

ตั้งแต่ 09/03/2026
2
การขาย
286
ติดตั้งฟรี